The popularity of moving averages in the financial markets has grown tremendously over recent past. Every now and then we come across headlines such as “Nifty breaks below 50 day moving average“ or “Crude Oil trading below its 200 day moving average”. What does all that mean? And what is their significance? Let us explore the term and its key features in a detailed discussion.
Understanding moving average is of great importance in stock market for trading
As the name suggests a moving average is an average that continues to move forward with the price, where the data for the latest day is added while the data of the first day is dropped on a rolling basis. Therefore to get a 5 day moving average one needs to add the closing price of last 5 days and divide it by 5, on the next day one needs to add the closing price of the previous day while remove the price of the first day of the series, which makes it a close trend following indicator.
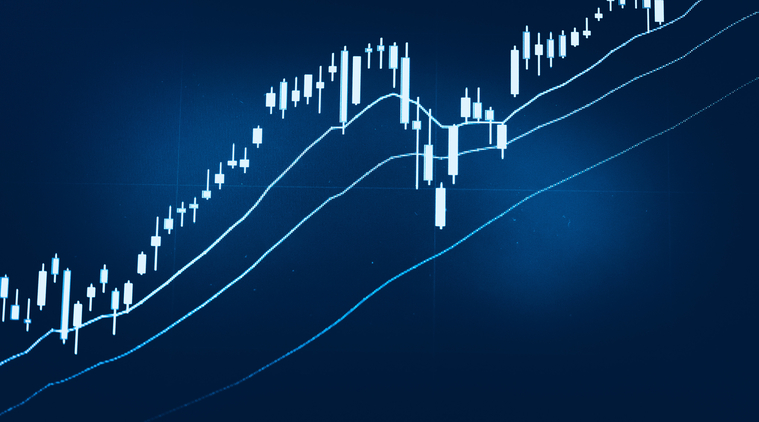
There are some popular categories of moving averages like simple, exponential and weighted moving average. The basic difference between the calculations of all three differs in assigning equal weight to the entire data or to put more weight to the latest data considering it to be more relevant. Apart from that difference in their calculations the usage and the interpretation of all the variants remain same. Before we go into further discussion let’s have a look how the moving averages are plotted on the charts –

Why Moving Averages?
Identifying Trend
In share trading, one of the most basic purposes of using moving averages is to know the underlying trend of the instrument. Generally speaking, in an uptrend the moving averages slope up and are placed below the prices, while in a downtrend they slope down and hover above the prices. Whenever the moving averages start shifting their positions from the existing stance it gives an early warning that the underlying trend may be changing and that’s what the traders keep a close watch on.
Act as Support and Resistance levels
Medium and longer term moving averages usually act as a good support and resistance level, therefore share market traders keep a close watch on such levels to initiate fresh long or short positions and also to exit their open positions.

Smoothing the volatility
Moving averages are also used as a proxy to smooth out the volatility in the prices. Using a longer duration moving average reduces the day today volatility amidst prices and presents a smoother picture of the trend. Day/ short term traders use shorter term averages to benefit from the volatility by generating short term trading opportunities. The chart below shows how a 100 day moving average stays below the prices for extended period of time , smoothing the day-today volatility and helping the longer term traders to stay with the trend against a 10 day moving average.

Mechanical Trading Systems and Strategy formulations
In an era where several mechanical share trading systems are developed to make profitable strategies, moving average form a crucial parameter to develop such strategies. Systems are usually developed to follow the trend to the greater extent and given the fact that the averages play a very important role in determining the trend they form the base for numerous strategies designing as well. The basic reason to deploy the averages so widely remain less subjectivity involved in their interpretation unlike the price patterns where the opinion vary from individual to individual.
Also Read : RSI: Simple yet Powerful Technical Indicator
Can be used in all duration
The beauty of the beast lies in its adaptability to serve the user in all the time frames. The moving averages are used in all the time frames ranging from intraday to daily, weekly and even monthly charts. The longer the time frame used the more significant it becomes and vice versa, while the longer the time frame the less volatile it becomes.
Conclusion
The fact that moving averages are trend following indicators and not leading indicator makes them laggard in nature, which means that there is always some time delay in the generation of signal from moving averages, however there are several other indicators available in the market which cater to this thing, but given the tremendous merits moving averages carry with them makes them a blessing for traders in the financial markets. Share Trading with the help of moving averages can be highly rewarding, however there are no free lunches in the markets so one needs to work which moving average fits best for any particular share market and individual’s share trading plan!
Alalyze Trade By Yourself
Start Trading In Share Market
[email-subscribers namefield=”NO” desc=”Subscribe now to get latest updates!” group=”Public”]


[…] figures out whether the market is trending or range-bound and accordingly applies the technical indicators to different phases. He identifies impending trend reversal and catches big moves in opposite […]
[…] Also Read Moving Averages […]