
The volume shocker scanner is highly useful in identifying potential profit-making stocks. The scan results of volume shocker scanner are divided into two categories – unusual volume and potential volume
What is volume shocker scanner & impact of it on stock trading online?
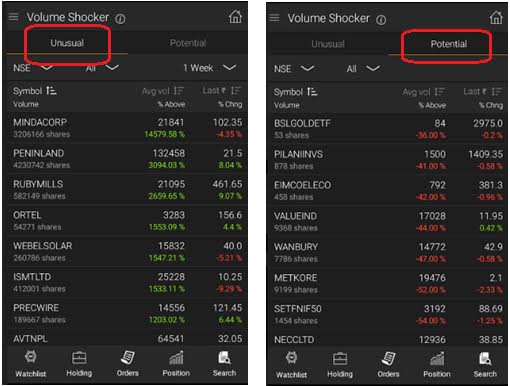
Volume Shocker – Unusual Volume
The scan results displayed in the ‘Unusual Volume’ section of the Volume Shocker scanner lists out the stocks whose daily volume has surpassed its average volume for the week or month.
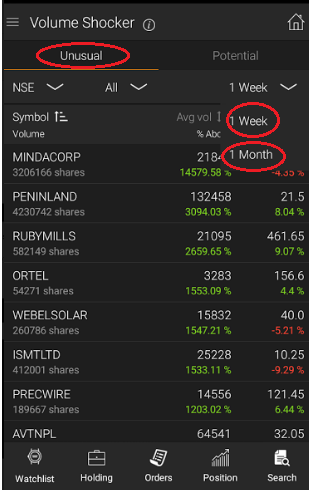
The unusual volume section is provided with a dropdown that has the options for selecting either 1 week or 1 month.
- On selecting ‘1 week’ from the dropdown, the list of stocks displayed would be the ones whose daily volume exceeded the average volume for the week.
- On selecting ‘1 month’ from the dropdown, the list of stocks displayed would be the ones whose daily volume exceeded the average volume for the month.
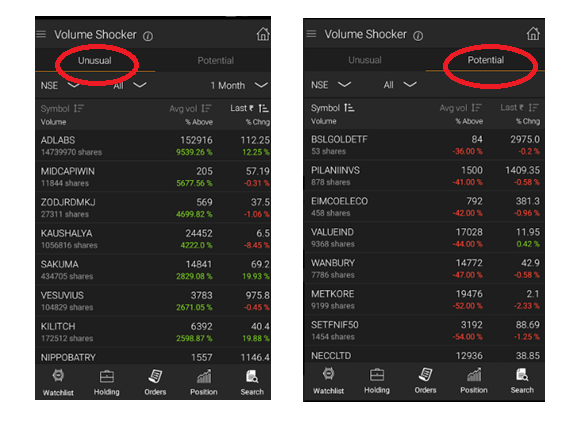
The above trading app screenshot shows the Volume shocker – Unusual Volume category. The default value of the dropdown is 1 week.
The results of the scan displayed consists of mainly two values – Average volume with % Above; and Last Price with % Change.
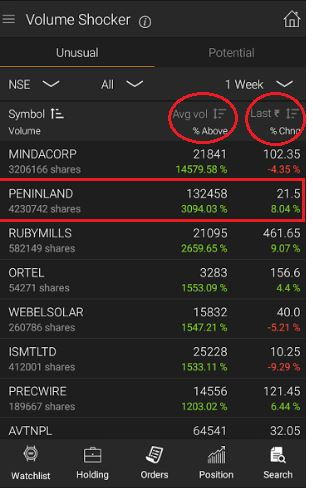
Example: In the above trading app screenshot, you can see that the stock PENINLAND has a current volume that is 3094.03% higher than the average volume of the previous week (132458).
The last price of the stock was 21.5 and had a % change of 8.04%.
Volume Shocker – Potential Volume
The scan results displayed in the ‘Potential Volume’ section of the Volume Shocker scanner lists out the stocks whose average hourly volume has surpassed its average hourly volume for one week.
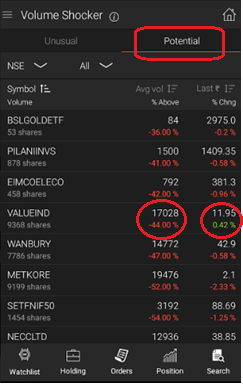
The above screenshot of Sine trading app shows the Volume shocker – Potential Volume category. Note that there is no dropdown available for selecting the timeframe, as the only timeframe used is 1 week.
The results of the scan displayed consists of – Average volume with % Above; and Last Price with % Change.
Example: In the trading app figure, you can see that the stock VALUEIND has a current hourly volume that is 44% lower than the average hourly volume of the previous week (17028).
The last price of the stock was 11.95 and had a % change of 0.42%.
Also Read : Rise & Fall Scanner
How to interpret trend using Volume Shocker scanner results
The result of Volume Shocker scanning can be used for evaluating the general trend of the stock.
- When Volume breakout occurs with a corresponding rise in price, a bullish trend is indicated.
- When Volume breakout occurs with a corresponding fall in price, a bearish trend is indicated.
This can also be indicated as shown in table below
| Volume Breakout | Price | Trend |
| |
Bullish | |
| |
Bearish |
Note: The Volume Shocker scanner can be used in conjunction with the Rise and Fall scanner to reinforce the overall view of the stock.
Steps to get the list of stocks of ‘Volume Shocker’ Scanner Criteria
Step #1: Login to Sine Trading App and click on the dropdown icon from Dashboard page.
Step #2: From the dropdown menu displayed, click on ‘Analytics’
Step #3: From the Analytics page, click on ‘Volume Shocker’ scanner.
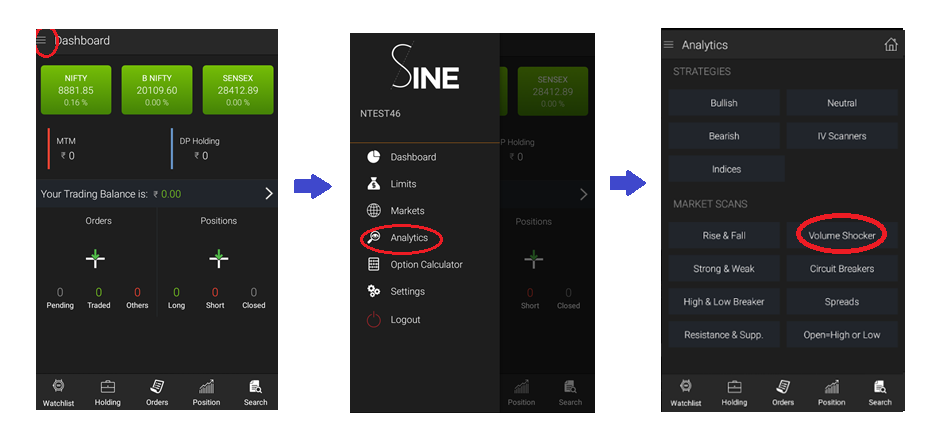
Step #4: The results of the scan would be displayed in two tabs – unusual volume and potential volume – as shown below
Calculations: Volume Shocker Scanner
The average monthly volume, as well as average weekly volume, are used for identifying the stocks with
- ‘Volume breakout – Price rise condition, as well as
- ‘Volume breakout – Price fall condition
Average Monthly Volume is the average volume of 22 days (trading sessions) and the Average Weekly Volume is the average volume of 5 days (trading sessions).
Following are the calculations. The current day is denoted as N.
Average Monthly Volume (MV) = Average volume of (N-1, N-2….N-22) days = (Sum of Volume of 22 days)/ 22
Average Weekly Volume (WV) = Average volume of (N-1, N-2….N-5) days = (Sum of Volume of 5 days)/ 5
Assume that CV is the current Volume of the stock.
Whenever CV is 1.2 times more than the weekly or monthly volume, the condition for volume shocker scanner would be fulfilled. Such stocks would then be displayed in the scan results. i.e;
- CV > 1.2 X MV : results displayed in monthly filter criteria
- CV > 1.2 X WV : results displayed in weekly filter criteria
Functions that can be performed on the Scanner Results list
Also Read : Circuit Breakers Scanner
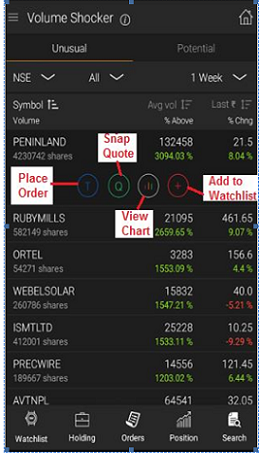
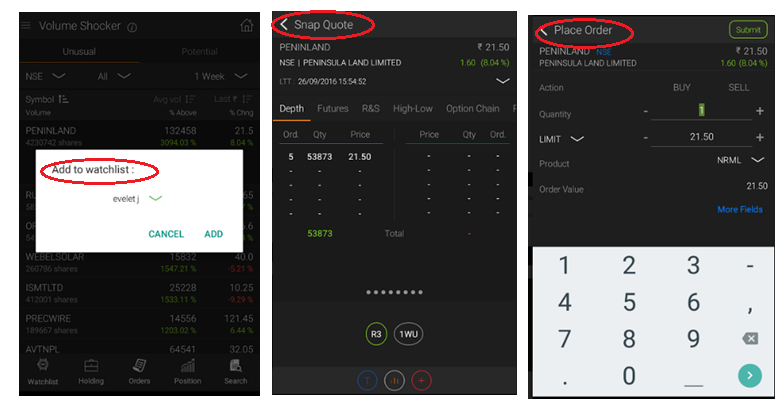
Various functions can be performed on the scanner results. For doing that, click on any of the stocks of scan result. Then the associated functions would be displayed below it. Following functions can be performed:
- Add to Watchlist
- Snap Quote
- Place order
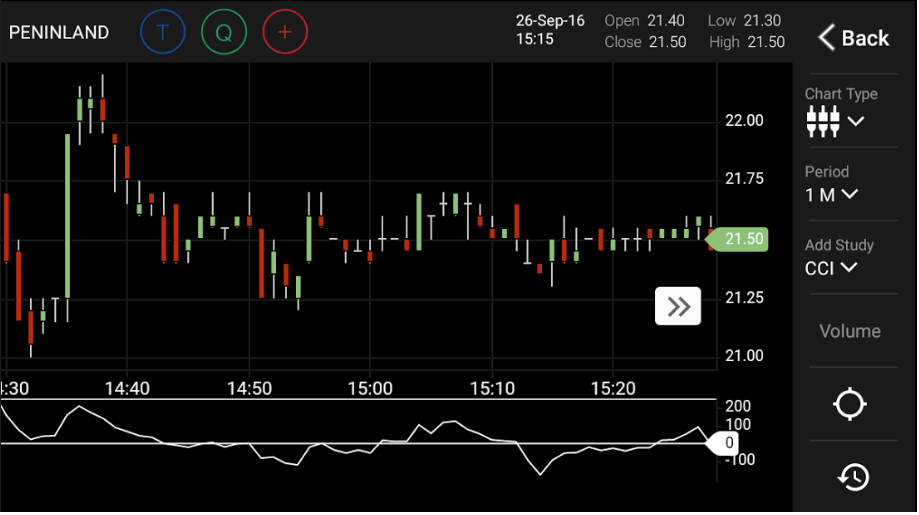
- View Chart – includes indicators like Bollinger Bands. MACD, moving averages, RSI etc.
On clicking on each of those symbols, the corresponding function is executed. The figure below shows the various functions.
Conclusion
Volume Shocker Scanner is exceedingly helpful in identifying stocks that have the potential to be bullish or bearish in the nearby future, thereby increasing the probability of making profitable trades.
Get Best Trading App
Start Trading With Us
[email-subscribers namefield=”NO” desc=”Subscribe now to get latest updates!” group=”Public”]


[…] trades from the bullish or bearish trending stocks. It can also be used in conjunction with ‘Volume Shocker’ or Rise & Fall scanner to further reinforce the trend […]
[…] Also Read Volume Shocker Scanner. […]