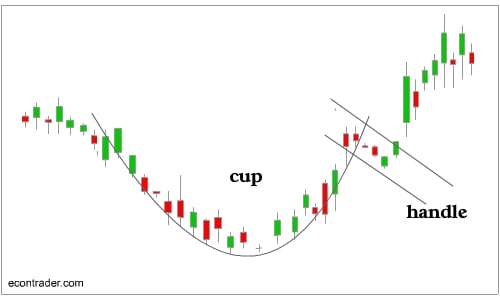
Cup and handle pattern is a unique charting pattern, which resembles morning tea-cup along with nice handle. Long slow alteration in the market direction is achieved by tea-cup pattern; while tight consolidation phase in the opposite direction resembles like a handle. The cup is in the shape of a “U” and the handle has a slight downward drift. The Cup and handle pattern is a sideways pattern and is ultimately resolved towards the open side of the “cup”.
Cup & handle chart pattern in share market
Take-care while detecting: Cups with the longer lasting and more “U” shaped bottoms are considered best. An ideal cup should not be too deep. Also, avoid cups with sharp “V” bottoms.
For handles: Avoid handles which are too deep. Ideally handles should form in the top half of the cup pattern. On the chart below, “Handle Low” point should keep above “Midpoint of base” for the pattern to be of significance.
The general rule is, the handle’s downward movement can retrace 1/3rd of the gain made in the right side of the cup. As a rule of thumb, shorter the handle duration, better the pattern performance.

One may attempt to draw a down-sloping trend line along the handle peaks. More often than not, one may be able to form a channel (resembling “Flag” pattern). A close above the trendline signals an early buy.
Pay Lowest Brokerage Now Start Trading With Us
Volume: As is normal for any sideways consolidation pattern; volumes should drop as the pattern progresses. Hence, the right-hand side of the pattern has low trading volume.
Volumes should dry up on the decline and remain lower than average in the base of the bowl. It should then increase when the stock finally starts to make its move back up to test the old high. The best case is for volumes to also form “Cup” pattern during initial days.
Also Read : Decoding a Technical Chart
Trading “cup and handle”:
The target for the pattern is computed height from the right saucer lip (Pivot) to the lowest valley in the pattern (Base Low).
Entry is suggested on breakout of “Pivot” point.
Stop can be kept at below the handle lows. A short handle (as discussed above), comes handy with better “risk to reward” ratio.

Performance of the pattern is superior on shorter handle size (in term of duration as well as price range). Also, flatter the base better the performance. A “V” shaped bottom is absolutely no-no, while attempting to trade “cup and handle” pattern.
“Cup and handle” chart pattern performs better as continuous pattern, than as reversal pattern. However, we still suggest trading the pattern for both, reversal as well as continuity.

Trading psychology involved: As the stock comes up to test the old highs (Left Cup), the stock will incur selling pressure by the people who bought at or near the old highs. Hence right cup is either equal to the left cup or less than that. This selling pressure makes the stock price trade sideways with a slight tendency for downtrend. This behavior forms the handle pattern.
Ultimately, sellers lose the battle and buyers have their say (if the pattern is to form). This marks the breakout of the handle.
Inverted cup with handle pattern: The cup and handle pattern is also applicable in reverse. So “cup and handle” is not necessarily a bullish pattern. Measurements and performance criteria for the pattern remains as discussed above.

Resemblance to head and shoulder pattern: If another handle forms at the start of the pattern (left of the pattern), the overall structure may also resemble “reverse head and shoulder” pattern. However trading concerns remain same in both the patterns.
Also Read : Double Top and Bottom formations
Elliott Wave considerations: Normally “Cup and handle” pattern marks beginning of the 5-wave pattern. Right saucer normally has small 5-waves rally after the bottom has been reached. Eventual explosion after handle (wave 2) formation marks typical characteristic of wave 3 (Motive wave).

Use Cup Handle Chart Pattern To Gain More Profit
[email-subscribers namefield=”NO” desc=”Subscribe now to get latest updates!” group=”Public”]


[…] Cup And Handle Pattern in Stock Market : Learn about the cup and handle chart pattern on stock, how to identify the trend reversal with this pattern. Read more at TradeSmart. […]
[…] Cup And Handle Pattern in Stock Market : Learn about the cup and handle chart pattern on stock, how to identify the trend reversal with this pattern. Read more at TradeSmart. […]
Hello Diab,
The technical indicator, Cup and Handle pattern may find at any point of the chart. To understand more about the indicator, one must take the thorough knowledge and take the decision.
Thank you so much for this Info, my question is cup and handle can be found in peak of the stock ( wave 5 ) , or should be found in end of wave (1) or (3)
[…] trading: Traders of this form wait for well-known patterns to form on the charts to exploit the market. In technical analysis, many repeatedly occurring […]
We are glad that you liked it 🙂 We will keep writing… Please share it with your friends too.
Nice info.. I like it