In trading, candlestick patterns are one of the most important tools for technical analysis.
They are used by traders to predict potential price movements based on past behaviour. Reading these patterns and identifying trading opportunities might be tricky if you are new to trading. Our article will cover more details on candlestick patterns, their importance, and the most commonly used patterns. Knowing these basics will help you make more informed and confident trading decisions.
What Are Candlestick Patterns?
To put it simply, candlestick patterns are visual representations of price movements over a specific period. They can help traders identify potential opportunities based on historical price behaviour. However, the recognition of the pattern is subjective, and the programs that are used for charting have to rely on predefined rules to match the pattern.
Candlestick patterns are important for traders as a single candlestick holds condensed information about a security (stocks, bonds, options, etc.). It shows the security’s opening, closing, high, and low price points throughout the period specified by the trader.
Components of a Candlestick Pattern
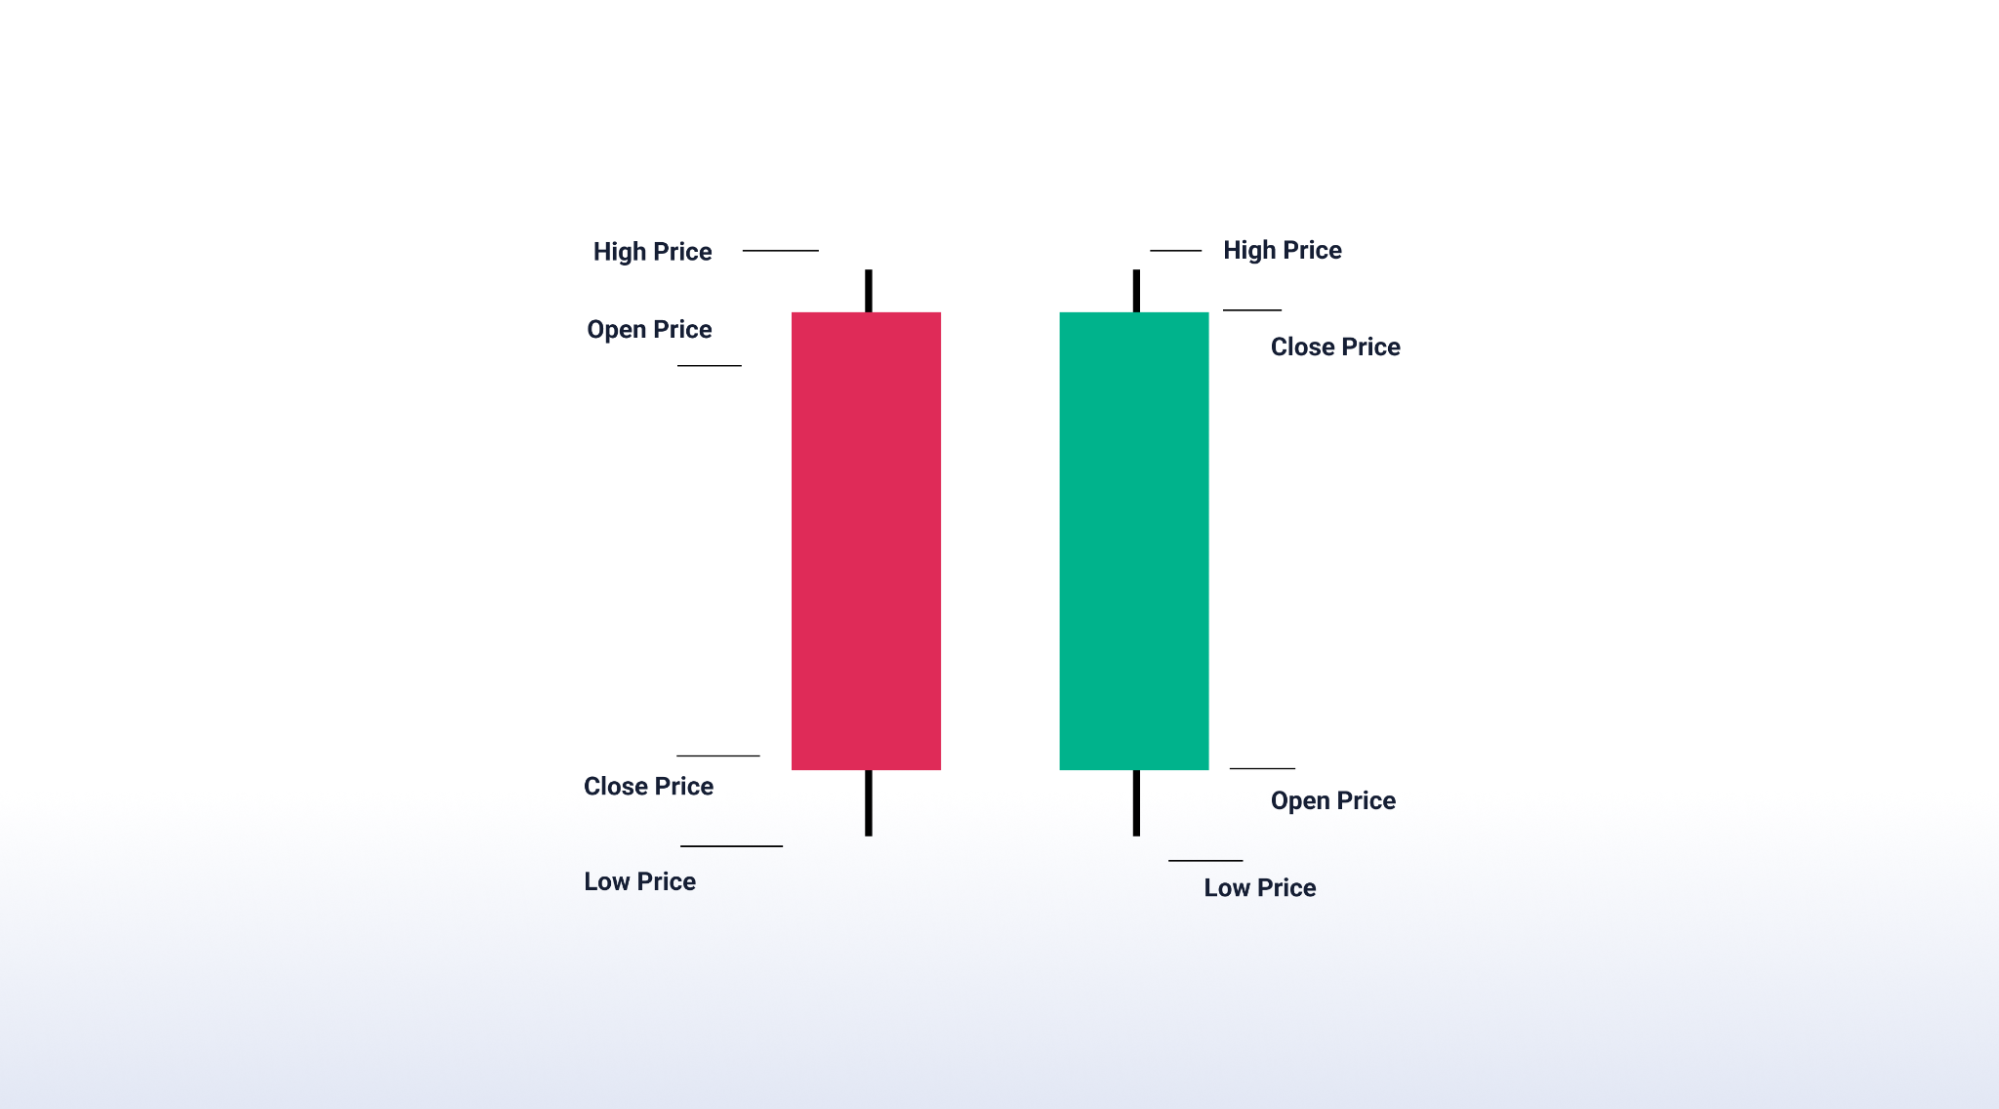
A candlestick has 3 main components –
- The Body: Represents the price range between opening and closing on a specific day of trading.
- The Wick: Also referred to as a shadow, this represents the high and low of the intraday.
- The Colour: This indicates the direction in which the market is moving. A green or white body is an indication of a price increase, while a red or black body shows a decrease in price.
While some candlestick patterns give insight into buying and selling pressures, others suggest potential price reversals or continuations.
It is important to remember that while candlestick patterns are useful, they should be used alongside other technical analysis tools for a well-rounded trading strategy.
Types of Candlestick Patterns
Overall, there are around 42 recognized candlestick patterns, which can be either simple or complex. In this article, we will cover the most commonly used candlestick patterns. Most traders use 3 to 6 patterns that can provide maximum accuracy.
TradeSmart 2.0, our easy-to-use mobile platform for stock trading can give you more information.
Before we move on to the different candlestick patterns, it is important to know that they are generally divided into 3 types:
- Continuation Pattern: They suggest a continuation of the current trend, be it bullish or bearish.
- Bullish Reversal Pattern: Appearing during a downtrend, they signal a possible upward reversal in price.
- Bearish Reversal Pattern: Appearing during an uptrend, they signal a possible downtrend reversal in price.
Continuation Candlestick Patterns
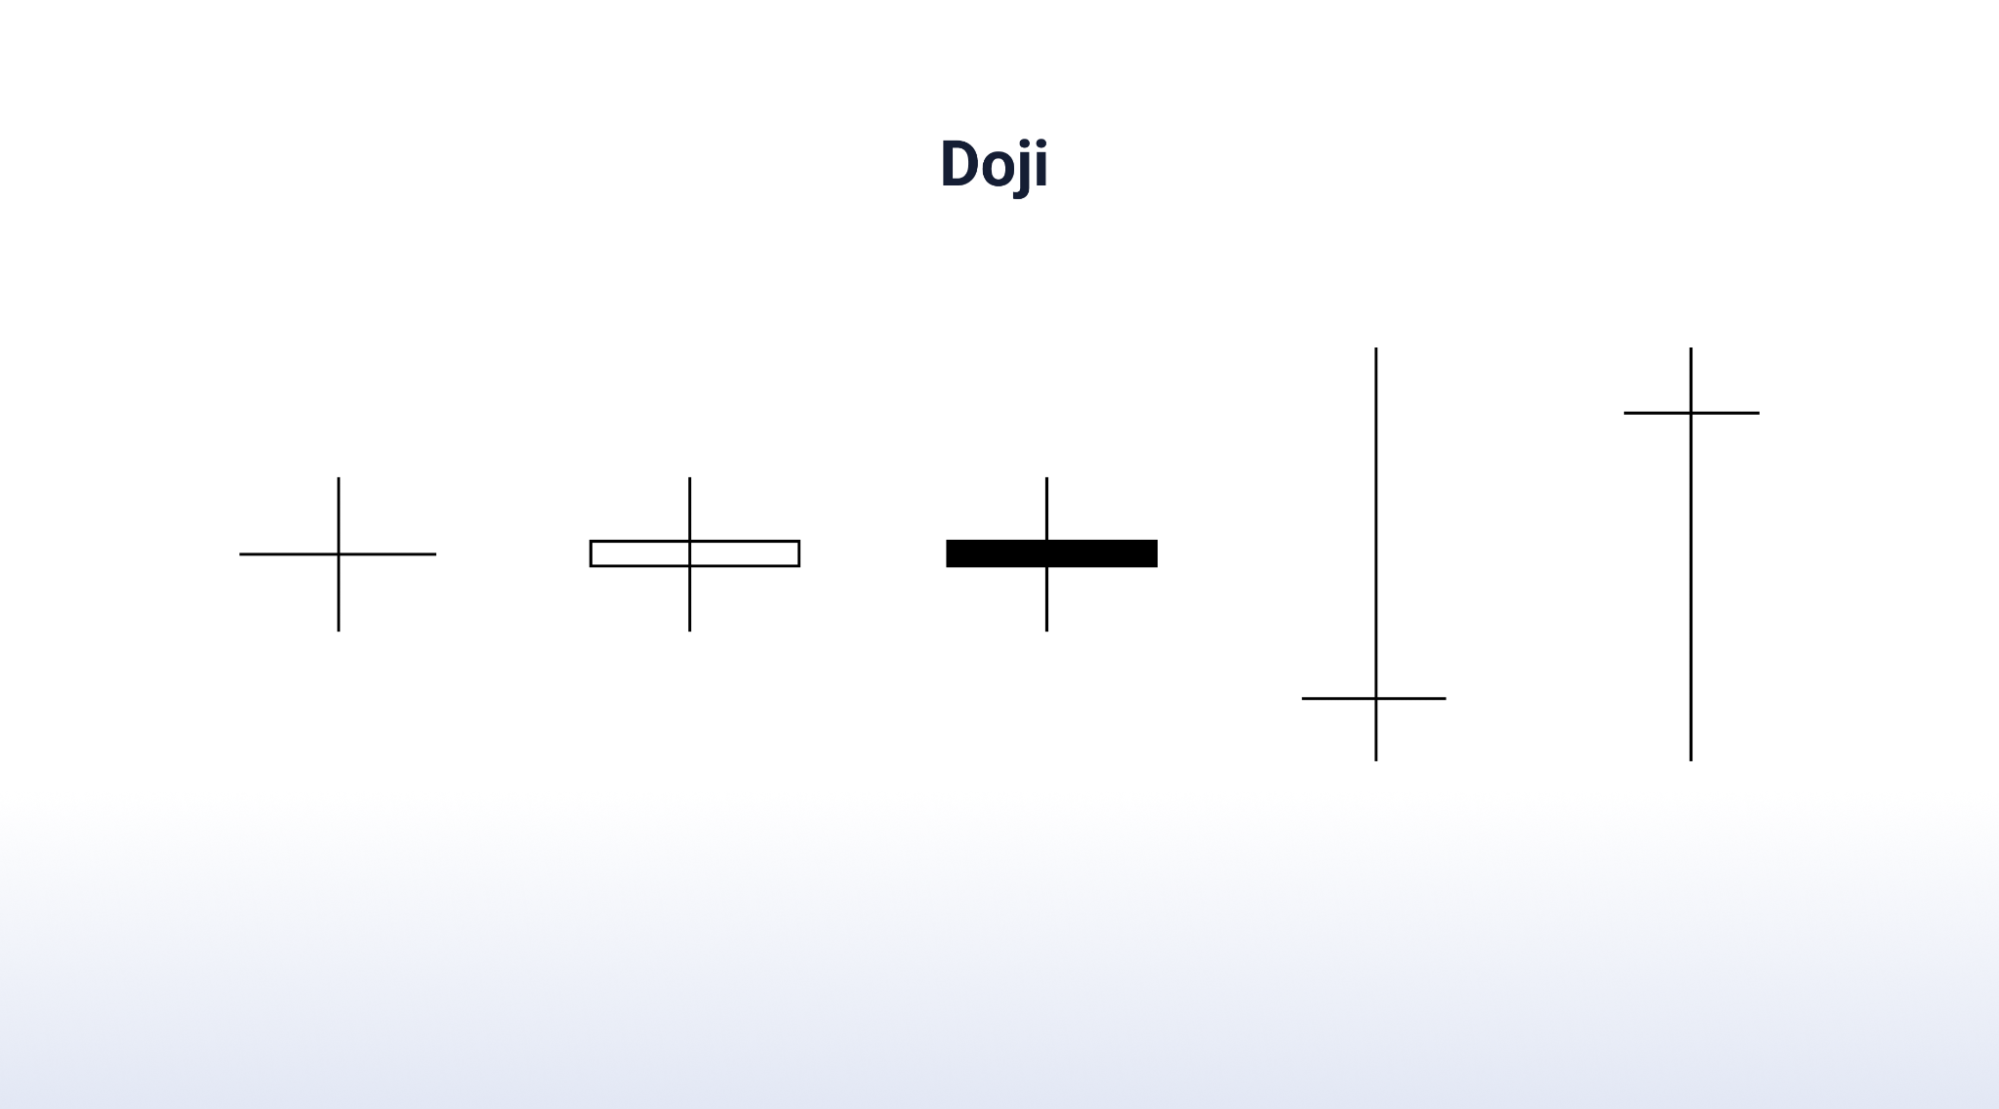
Doji
Appearing when a share’s opening and closing prices are virtually equal, Doji conveys an indecision in the market. It may lead to no net gain either for buyers or sellers. The tail of the candle varies from stock to stock, but the resulting candlestick should look like a cross, inverted cross, or plus sign.
Spinning Top
Similar to Doji, Spinning Top also indicates market indecision. It appears as a short body, indicating a small difference between opening and closing prices. The upper and lower wicks are longer and almost equal in length. It represents the struggle between buyers and sellers pushing the prices in both directions and ultimately ending up near the opening price. They are often considered as a temporary pause following an uptrend or a downtrend.
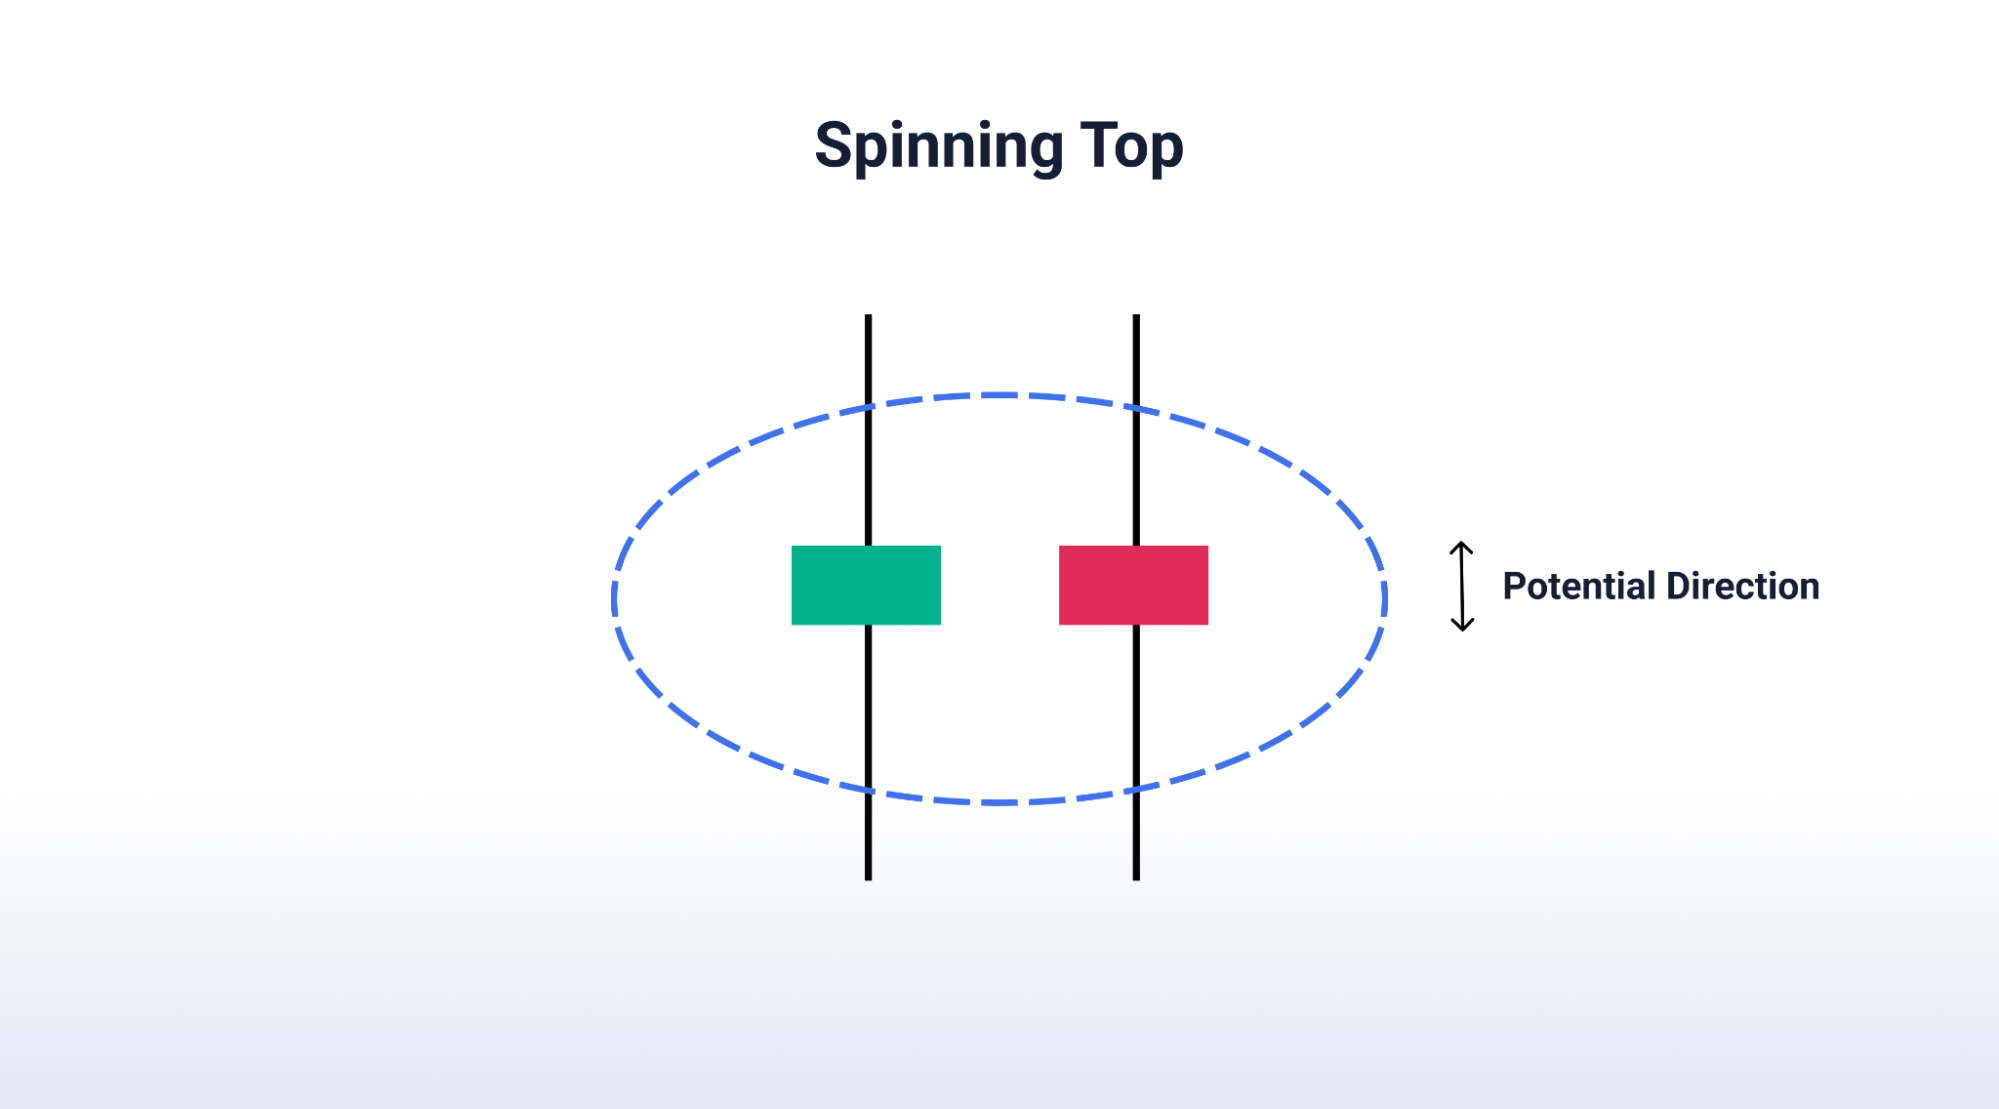
A spinning top may also indicate that the current upward or downward trend is losing strength and a potential reversal is coming up.
Bullish Candlestick Patterns
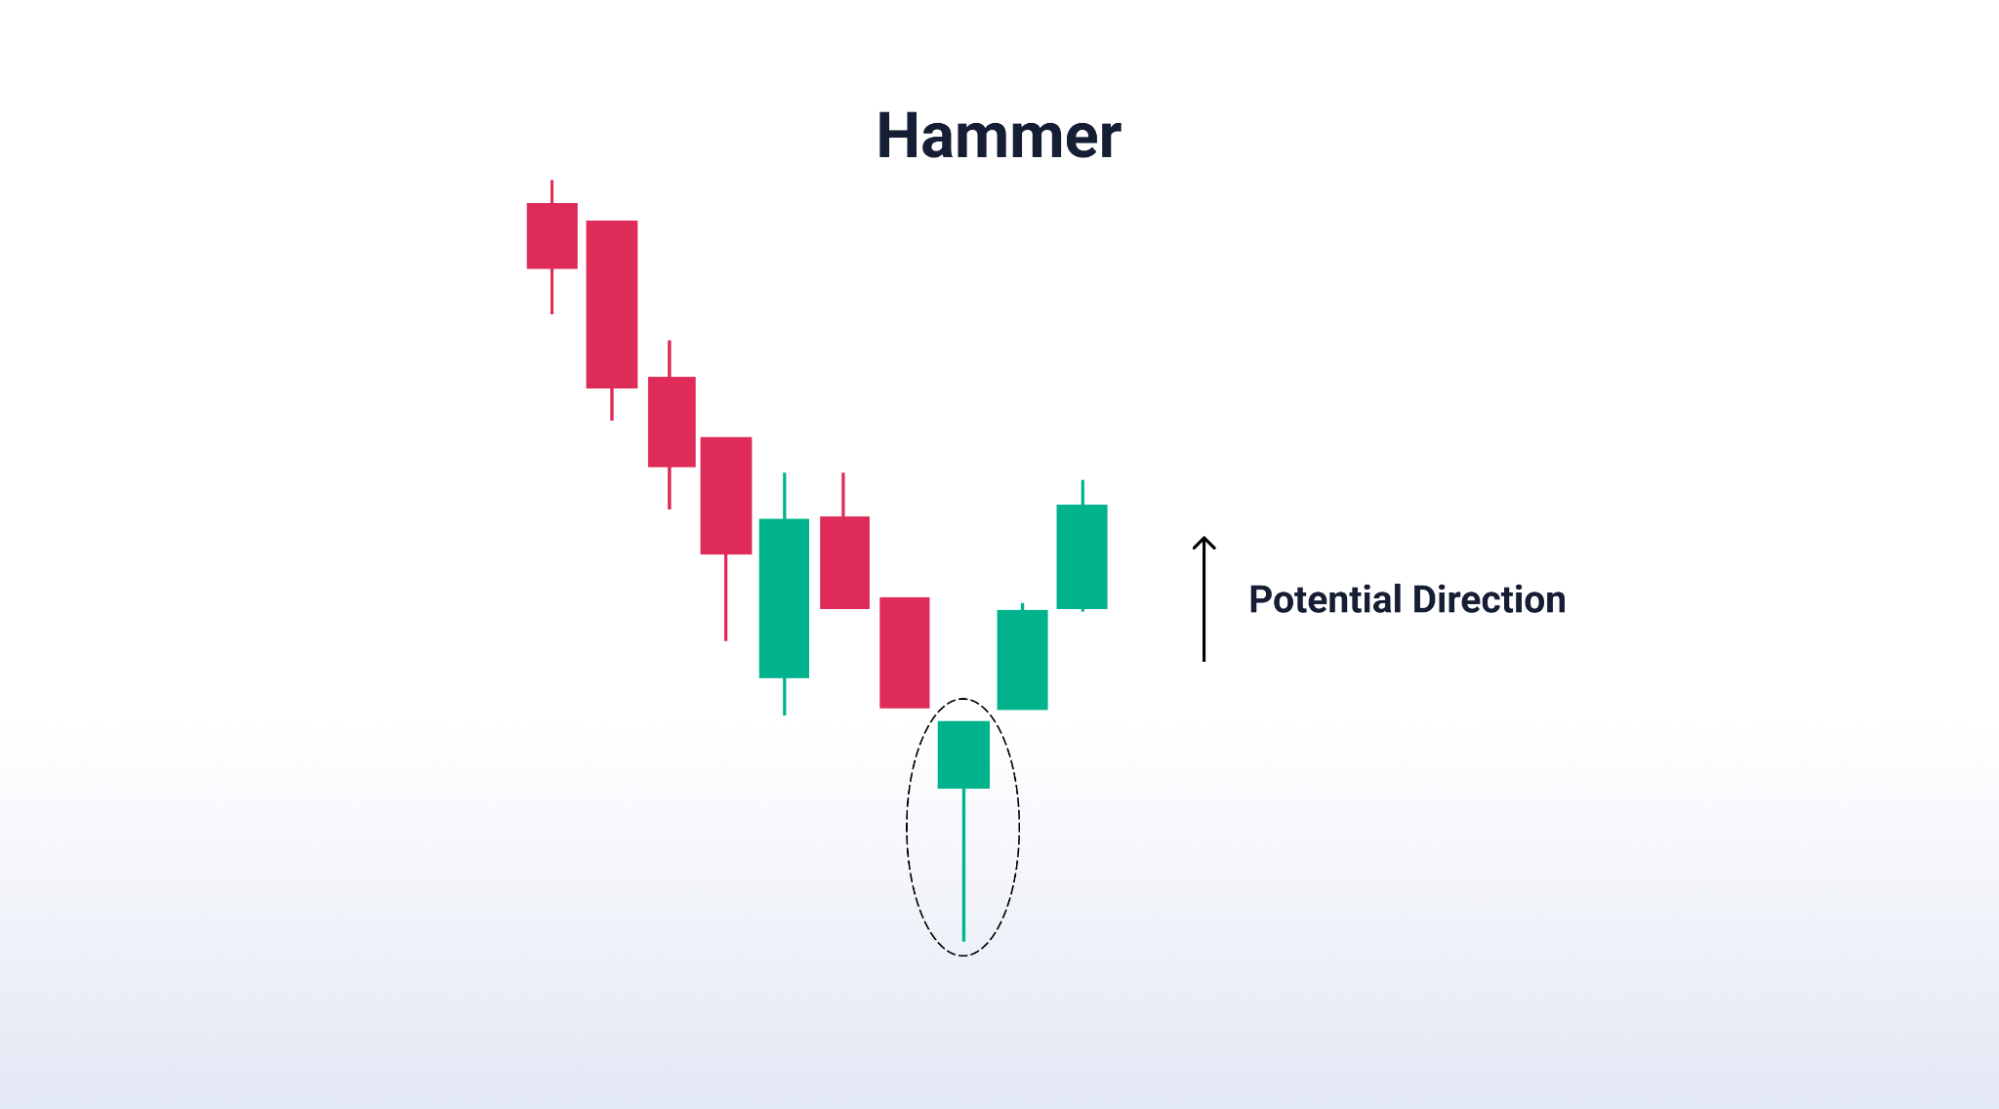
Hammer
Hammer signals a potential reversal in the price direction. It generally appears at the bottom of a downtrend. Hammer indicates that even with selling pressures during the day, the price was driven up by a strong buying pressure, and closed near the opening price. The appearance of this candlestick pattern is a short body with a long lower wick.
Kickers
Kicker candlestick patterns can be both bullish and bearish. The candles do not require any proceeding trend to forecast the stock price of the next day. Analysts believe the pattern to be one of the most powerful candlestick signals. It is said to be very effective as it is characterised by a very sharp reversal in the price during the span of two candlesticks.
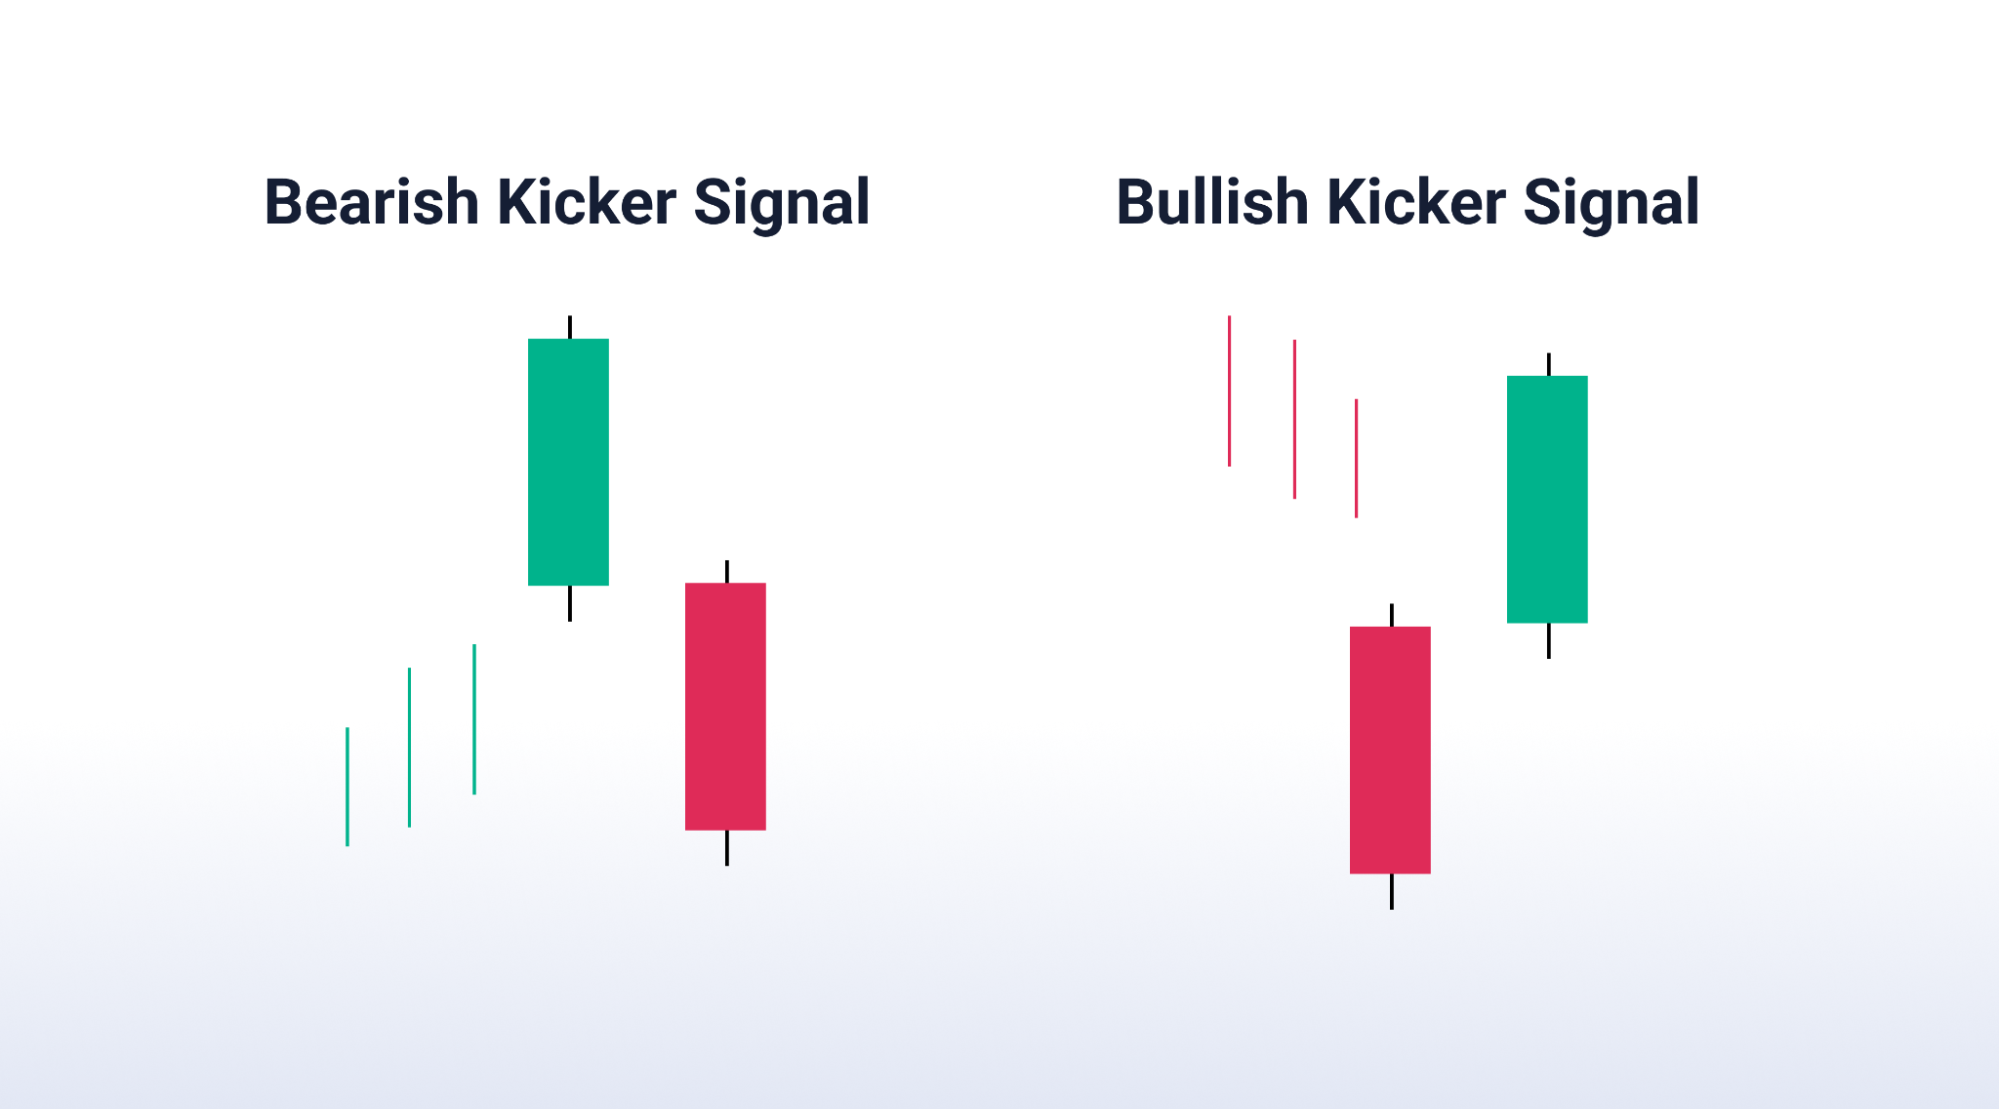
These kicker patterns generally form because of some recent news or surprising returns. It could be an earnings report, or an analyst’s upgrade/downgrade.
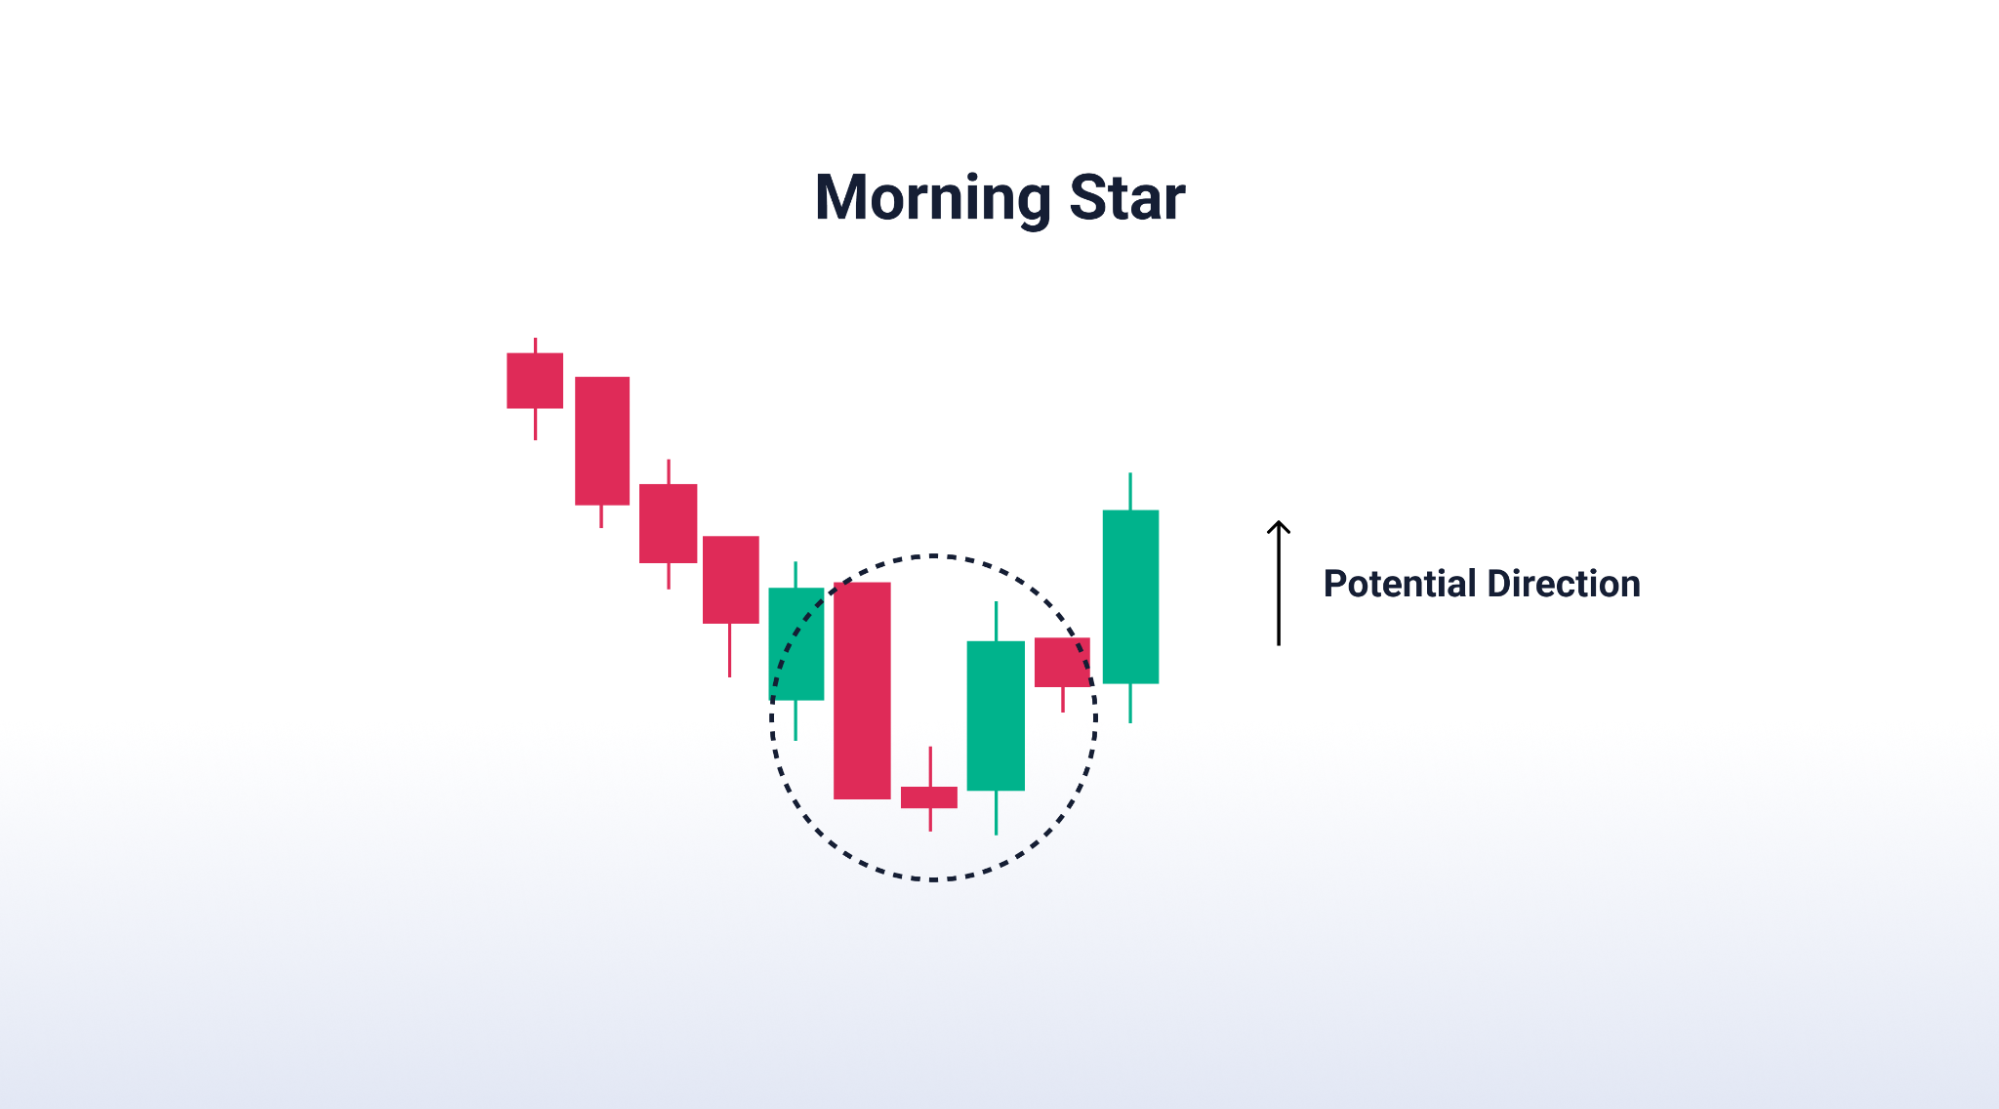
Morning Star
Morning Star is a 3-candle pattern that appears during a downward trend and signals a potential uptrend. The first candle has a long red/black body that signals a continuing downtrend and strong selling pressure. The second candle has a small body and could be either black/red or green/white. It suggests indecision in the market as neither buyers nor sellers gain dominance. The third candle is a long green/white body suggesting that the buying pressure is overcoming the selling pressure, potentially reversing the downtrend.
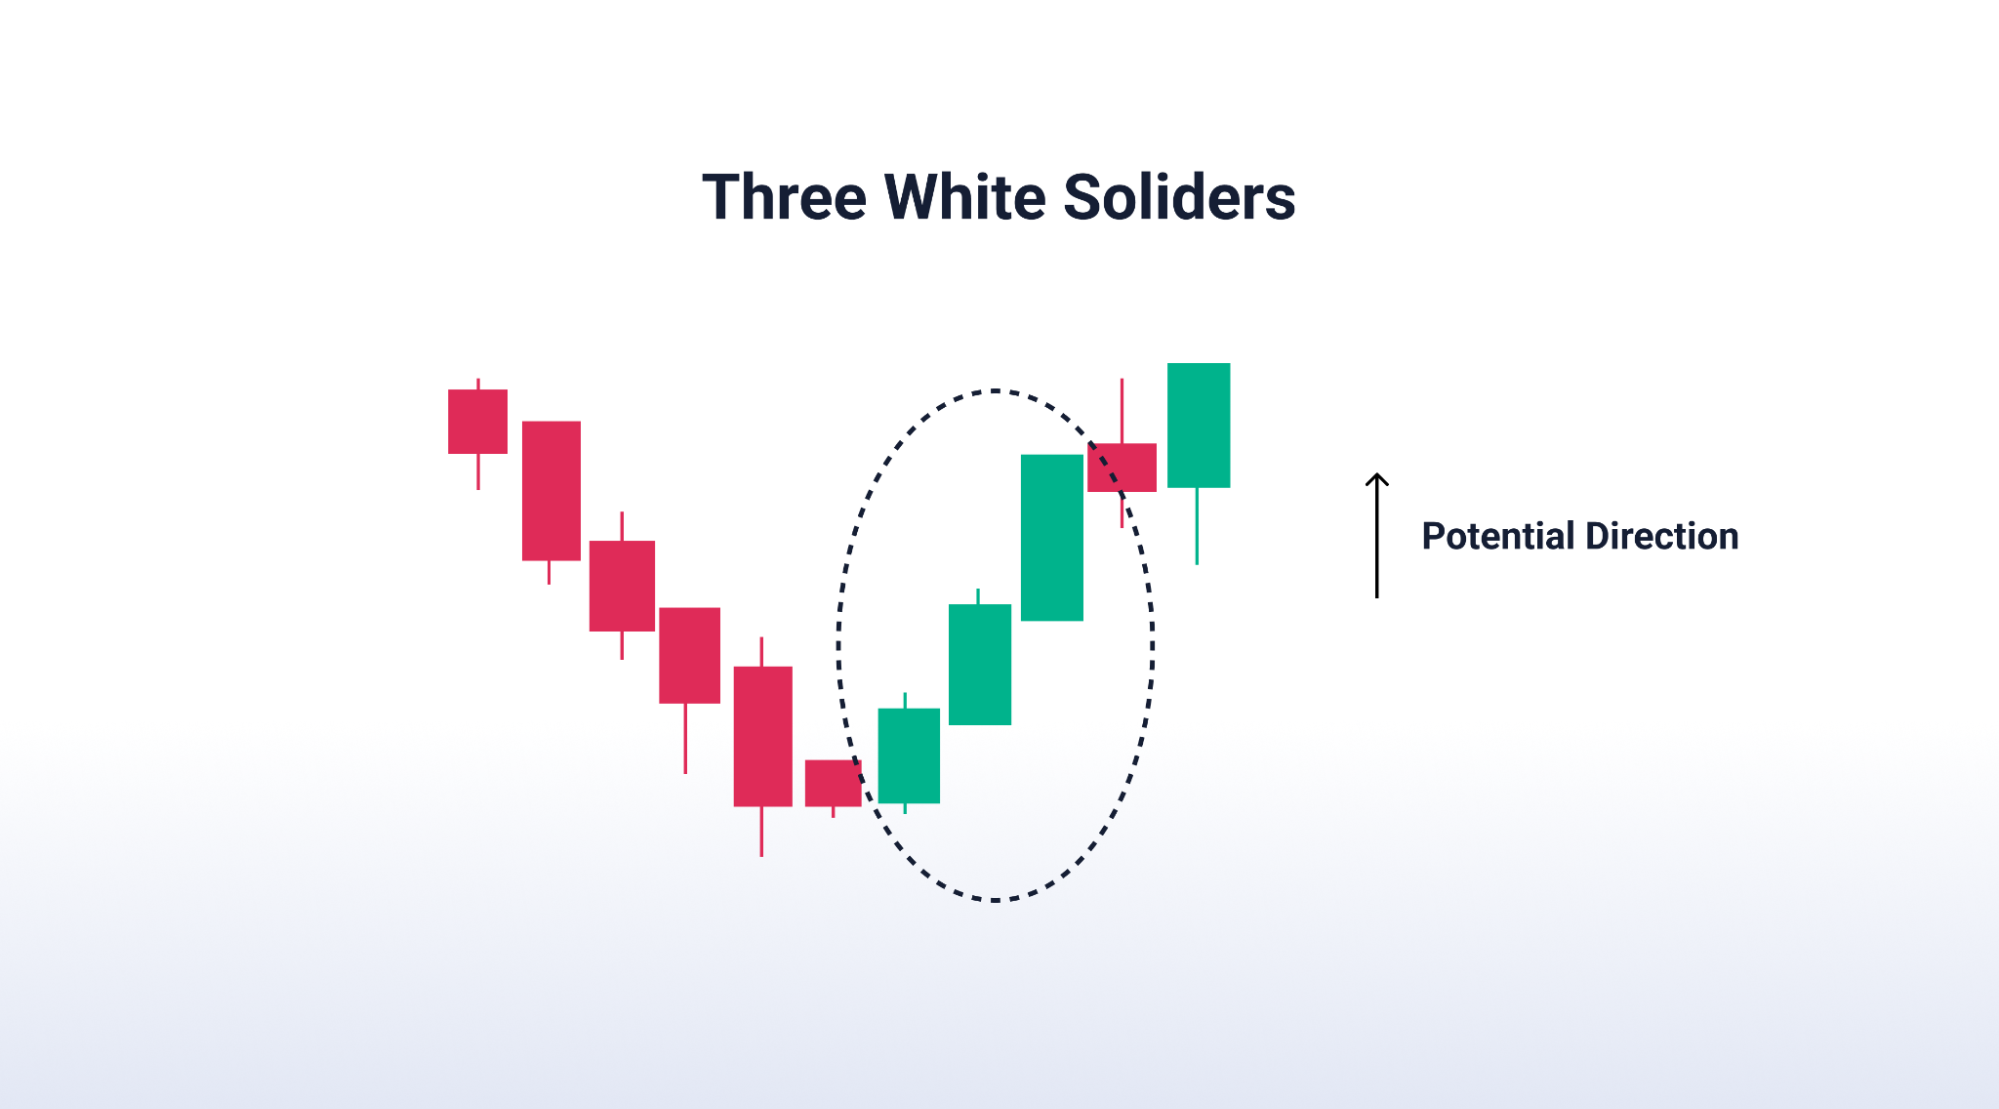
Three White Soldiers
This is a very strong bullish reversal candlestick pattern that indicates a potential uptrend following a downtrend. It appears as 3 consecutively longer candles with green or white bodies, signifying considerable price increases over each trading day. There are minimal or no upper wicks, showing that buyers stayed in control throughout the day.
Bearish Candlestick Patterns
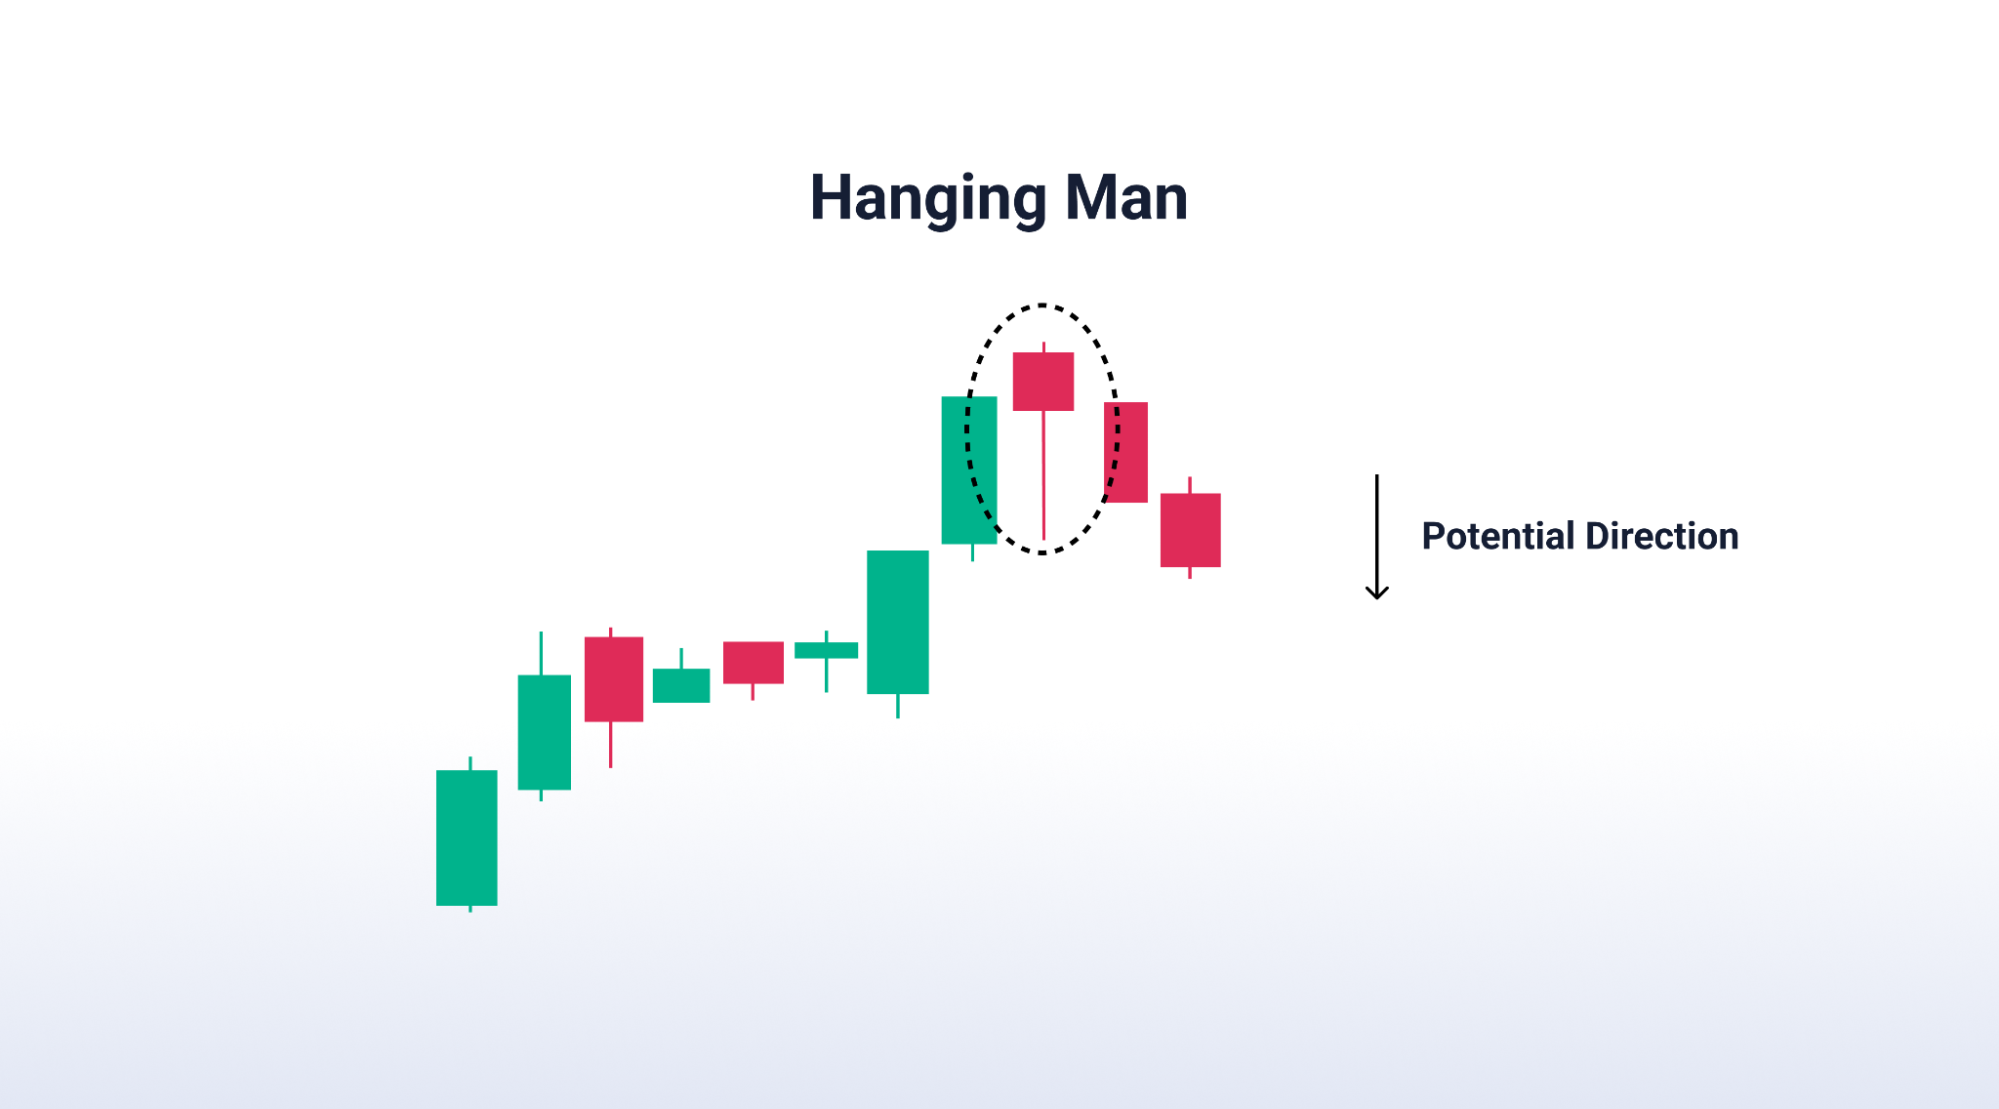
Hanging Man
This bearish reversal pattern typically forms at the end of an uptrend. The shape is similar to a hammer, making it a bearish equivalent of the bullish reversal pattern. It indicates that while selling pressure was strong, buyers were able to push up the price near the opening. It can indicate a trend reversal to the downside as bulls might be losing control over the market.
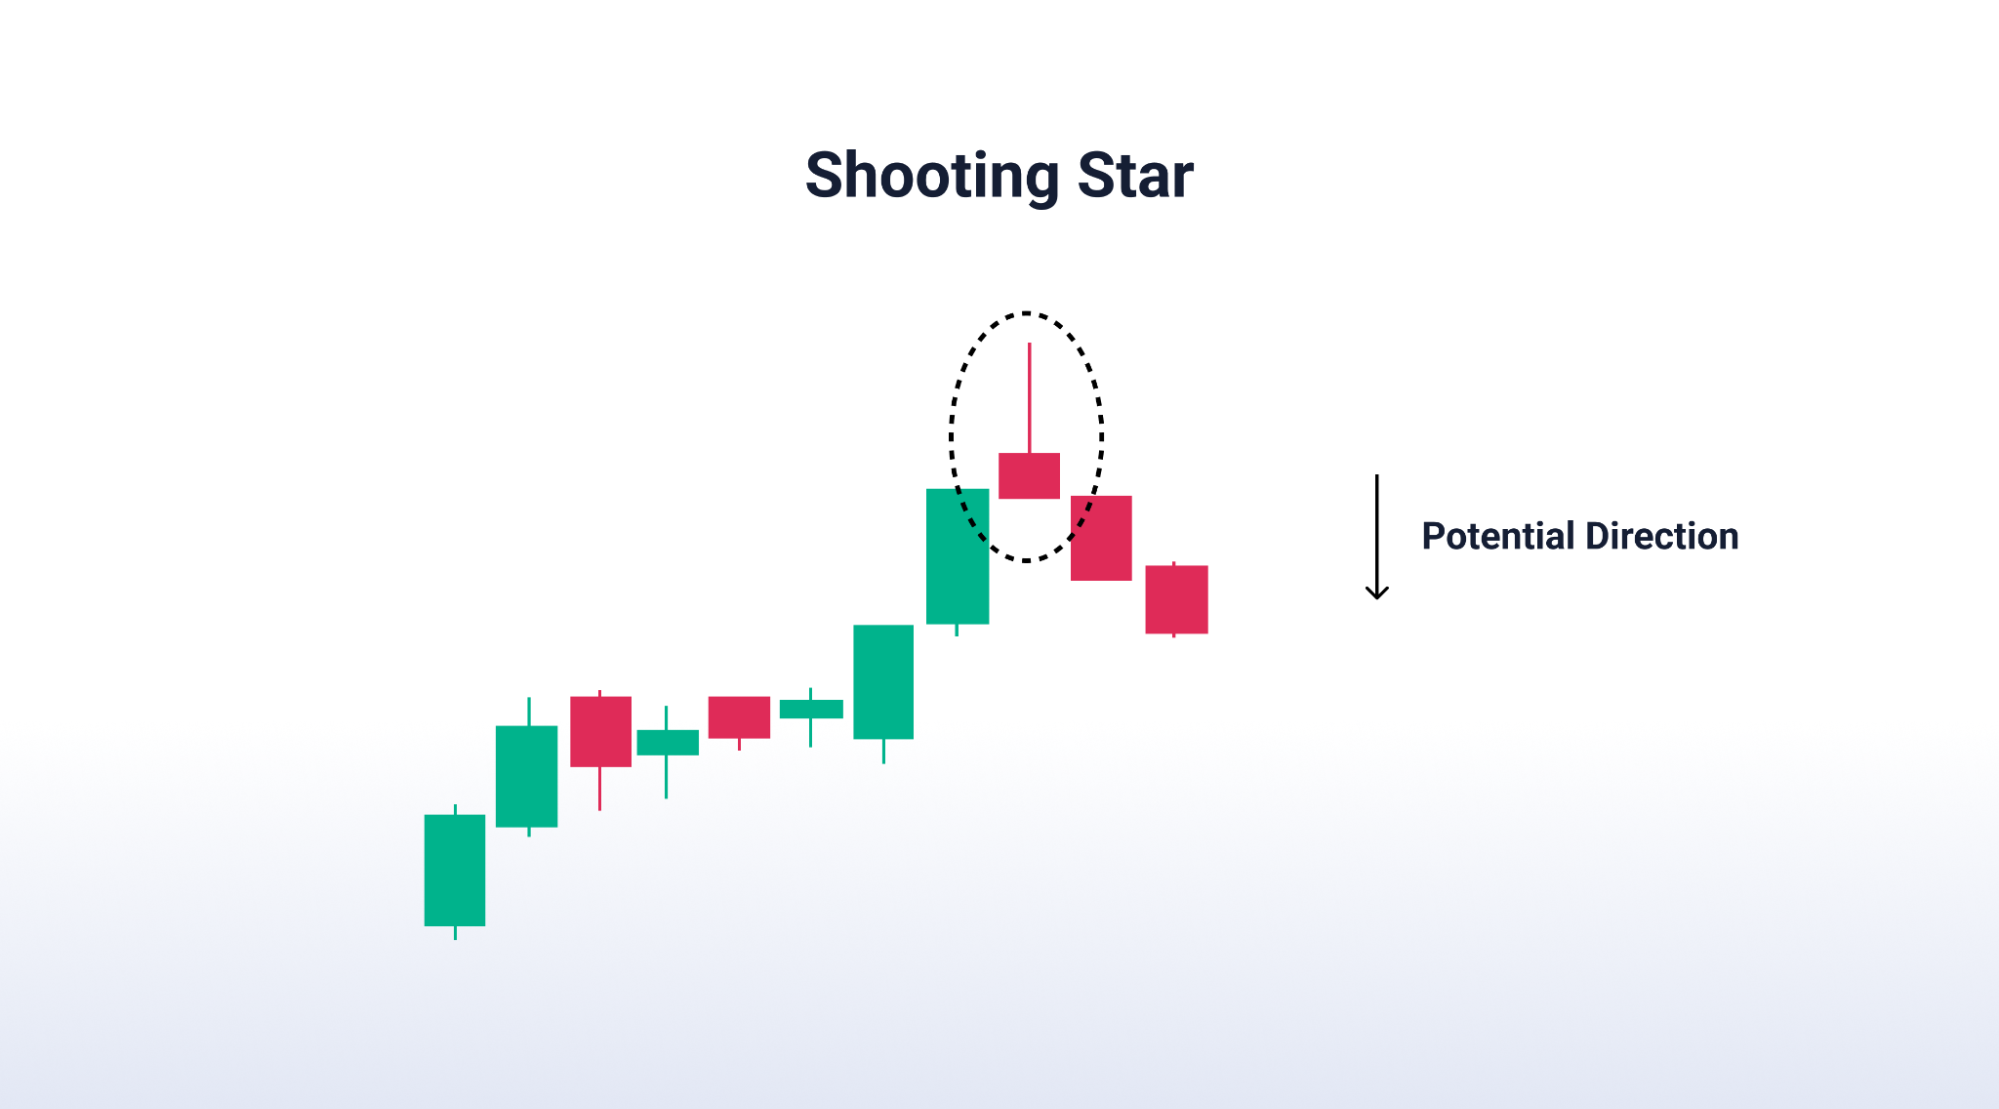
Shooting Star
The Shooting Star signal is found at the top of an uptrend. Generally, the stock represents the sentiments that the bulls had complete control of the trend. The next day, the buyer tends to move the stock to a very high level, which causes a very high wick. Suddenly they realize the stock is now in the overbought territory therefore they hold on waiting for the next day to test the bear’s persistence. The next day, if the bears are able to take the stock lower then bulls go away, eventually leading to a reverse trend.
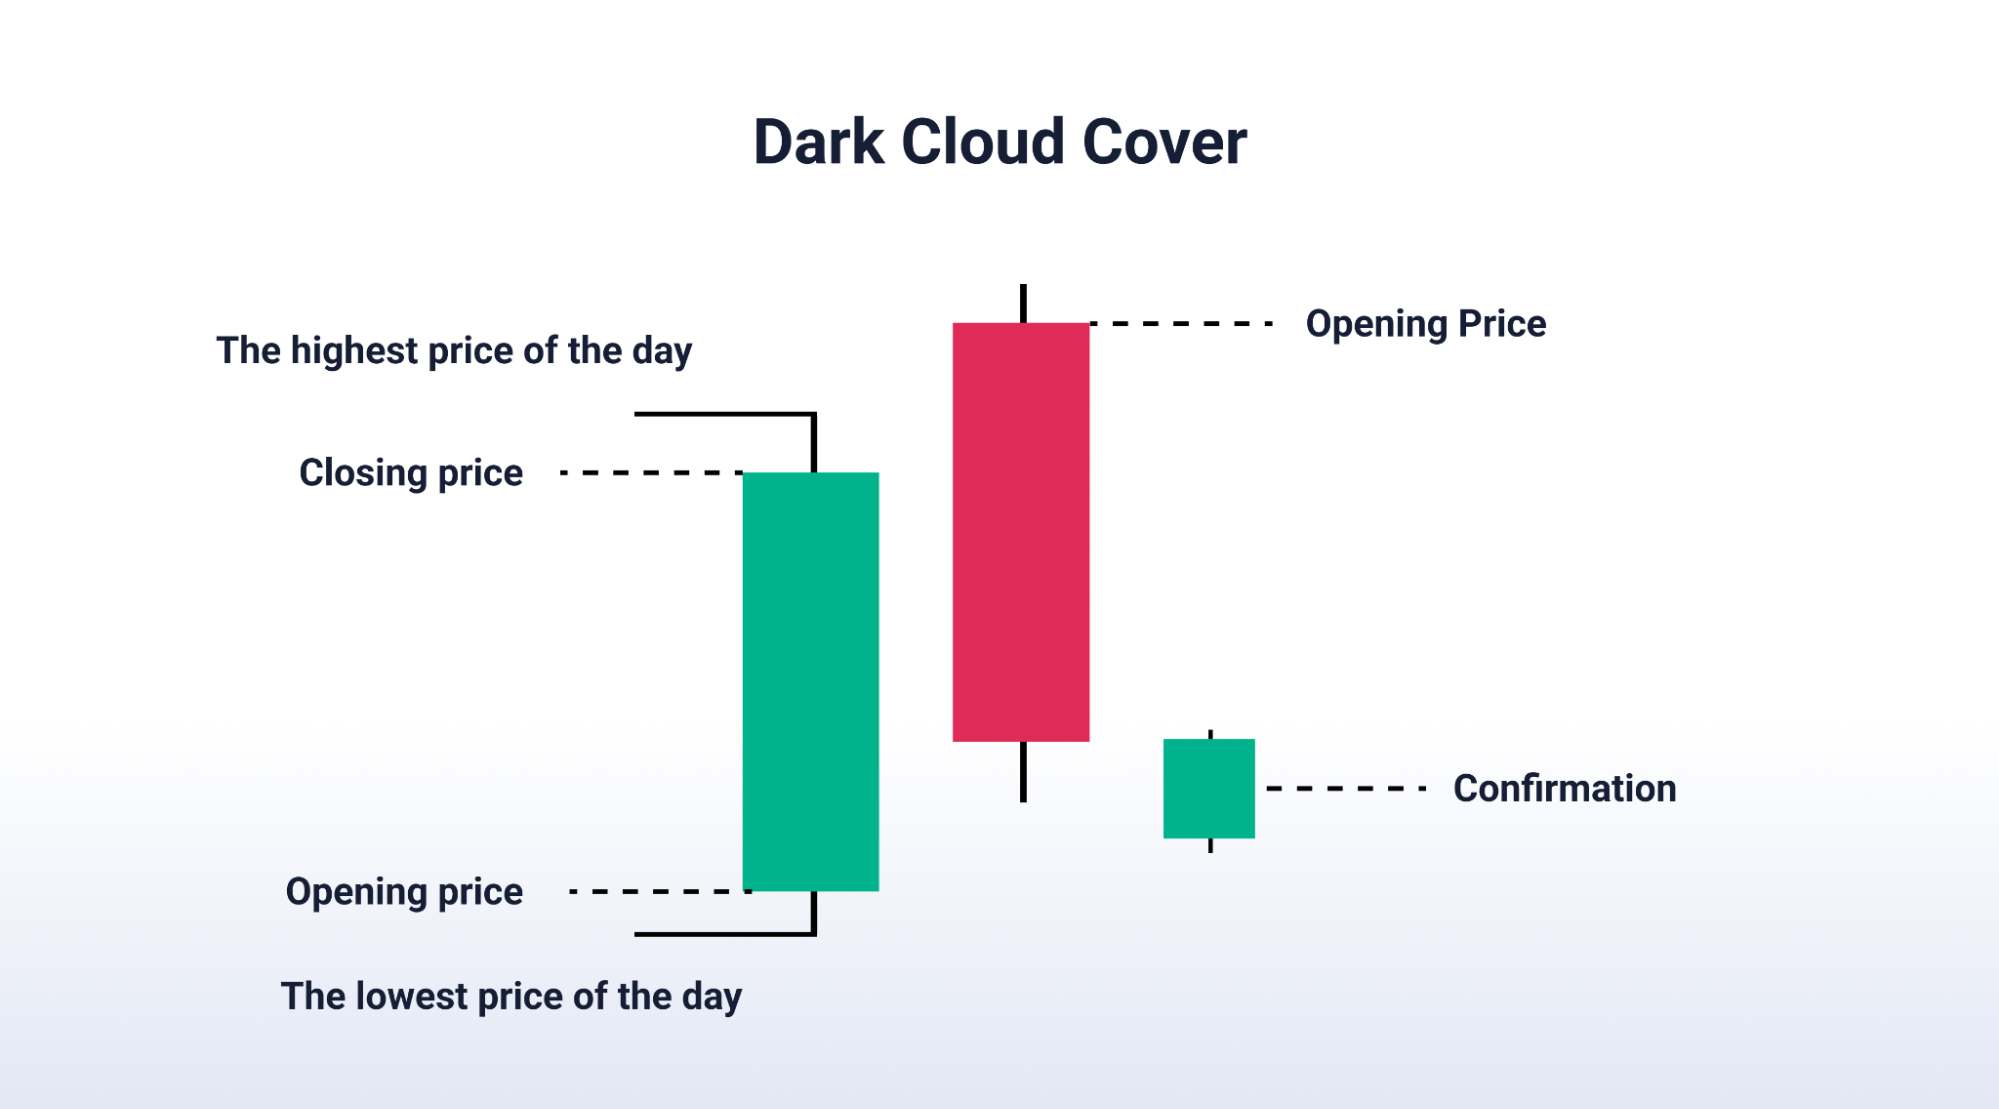
Dark Cloud Cover
Dark Cloud Cover is a single candlestick pattern found at the top of an uptrend. Generally, here the stock is initially in the uptrend from the last few weeks or days. But, the next day suddenly a black/red candle opens above the high of the previous day and closes more than halfway into the body of the previous day’s white/green candle.
The sentiments that the pattern reflects is that after the prices have risen for days, now the prices do not look so much attractive to the buyer. Suddenly, the buyers having a maximum holding of the share drop their positions, which causes a sudden fall in the share price.
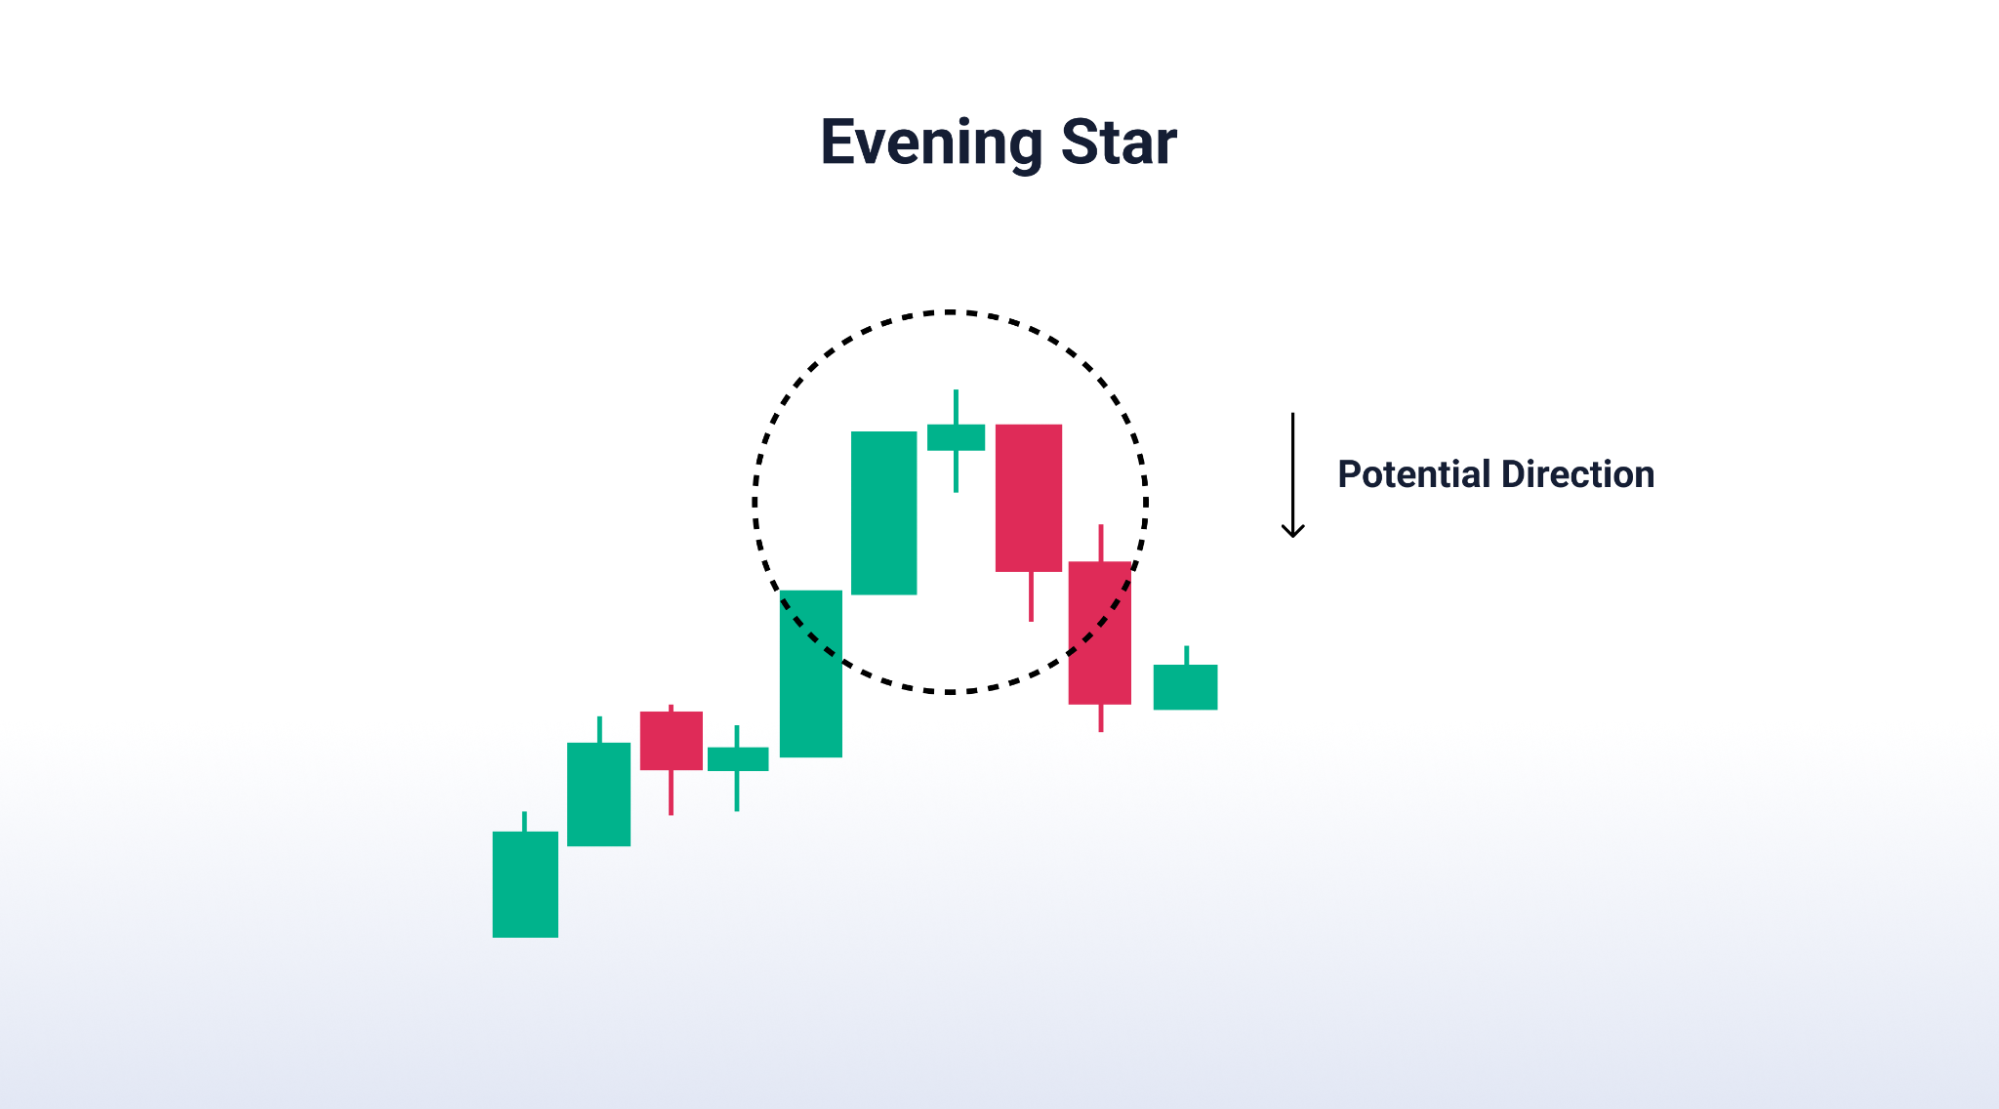
Evening Star
This 3-candlestick pattern is the bearish equivalent of the bullish Morning Star. Appearing in an uptrend, it signals a potential shift in the market sentiment from buying to selling. The first candle has a relatively long green/white body that indicates a strong uptrend. The second candle has a smaller body that can be either green/white or black/red. It reflects the market indecision as neither buyers nor sellers gain the upper hand. The third candle has a relatively long red/black body that suggests selling pressure overcoming the buying pressure.
Conclusion
Candlestick patterns are a valuable technical analysis tool for predicting potential trend reversals or continuations in the price of securities. Knowing the different types of patterns and how to read them can help you identify and capitalise on trading opportunities. However, it is important to remember that the patterns are not always foolproof. They should be used with other technical indicators, fundamental analysis, and risk management techniques for a well-rounded trading strategy.
Ready to step into trading waters? Open a FREE demat account with TradeSmart and trade with a brokerage rate as low as ₹15. With over 2 decades of experience in the stock markets of NSE and BSE, we are well-equipped to offer you real-time support during market hours.
FAQs
Q. What are candlestick patterns?
In technical analysis, candlestick patterns are visual representations of potential future movements in the price of a security. They are formed by the stock’s opening, closing, high, and low price points over a specific period, typically a day. It could also be over a week or a month. By analysing them, traders can assess the market sentiment and make informed decisions.
Q. What are the different components of a candlestick pattern?
There are 3 main components of a candlestick pattern:
– A body that represents the difference between opening and closing prices.
– Wick or shadow that represents the high and low prices of the intraday.
– Colour that indicates the price direction. Green/white is for price increase and black/red is for price decrease.
Together, they signify buying or selling pressure, potential trend reversals, or continuation of a trend.
Q. What are the different types of candlestick patterns?
There are around 42 different candlestick patterns, each with its own characteristics, simplicity, and complexity. Some of the most commonly used patterns are Doji, Morning Star, Evening Star, Hammer, and Hanging Man.
Q. What are continuation, bullish, and bearish patterns?
A continuation pattern (Doji, Spinning Top, etc.) suggests that the current trend, either bearish or bullish, is likely to continue. Bullish reversal patterns (Morning Star, Hammer, etc.) suggest a possible upward reversal in price following a downtrend. Bearish reversal patterns (Evening Star, Hanging Man, etc.) suggest a possible downward reversal in price following an uptrend.
Q. How reliable are candlestick patterns?
Candlestick patterns are valuable tools, but not foolproof. They should be used alongside other technical indicators, fundamental analysis, and proper risk management for a comprehensive trading strategy. This can help traders make more informed decisions.


[…] Also Read : Some Candlestick Patterns To Help Make Better Decisions […]
[…] Also Read :- Some Candlestick Patterns To Help Make Better Decisions […]