Introduction :-
There are many tools and techniques in stock market available which help beginners to strategize their next move. Due to which, online trading is becoming the next big thing. Stochastics is one of these technical indicator. In securities trading, the stochastic oscillator is a momentum indicator that uses support and resistance levels. Dr. George Lane developed this indicator in the late 1950s. The term stochastic refers to the point of a current price in relation to its price range over a period of time. Stochastics aim to predict turning points by comparing the closing price to its price range. For example,
Get share trading profit using Stochastic indicator
The 20-period stochastic oscillator in a daily timeframe is defined as:
%K = (Price-L20)/(H20-L20)
%D = 100*((K1+K2+K3+K4+K5)/5)
Where H20 and L20 are the highest and lowest prices in the last 20 days. %D is the 5-day moving average of %K (the last 5 values of %K). This is a simple moving average but could be exponential moving average too. Such moving averages and tools can be viewed using online stock trading platforms provided by various brokerage firms in India.
What is the intuition behind stochastic indicator?
The indicator basically maps the recent price movements to the range in 0-100 and then tries to assess the whether the price is trading at lower end of the range or the higher end of the range. If the security is closer towards the lower end of the range then the stock could be in for reversal and start moving on the upside. A more effective way of using the stochastics is to observe a trend where prices are hitting higher highs but the stochastic indicator starts to turn down. When in retreat it shows that the momentum has slowed and market could turn lower.
Gain Profit Now! By Using Stochastic Indicator
The interpretation
The signal to observe the divergence-convergence especially in an extreme area, with a crossover on the right hand side, of a cycle bottom.As plain crossovers can occur frequently, one typically waits for crossovers occurring together with an extreme pullback, after a peak or trough in the %D line. If volatility in prices is high, an exponential moving average of the %D indicator should be taken. This can help smooth out rapid fluctuations in price.
Prices also have a tendency to close near the extremes of the recent range just before turning points.
Example
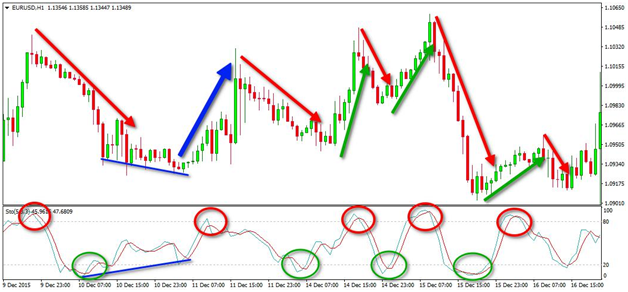
The green red circles indicate overbought stochastic signals. Every time we get this signal the price records a decrease.The green circles on the chart point out to oversold signals on the chart. When we get this signal the price increases.The blue lines on the chart indicate a bullish divergence between price action and the Stochastic Indicator. After the divergence the price increases. The same can be observed in trading app provided by brokerage firms.
As you see on the image above, the Stochastic Oscillator gives many signals. Each of these signals has the potential to put you in a trade. However, since the signals anticipate the real event on the chart, the Stochastic Indicator success rate is relatively low. Therefore, you should always combine this indicator with an additional trading tool or trading platform. The reason for this is that the Stochastic is not a good standalone trading indicator in online trading app.
Stochastic divergence
An alert or set-up is present when the %D line is in an extreme area and diverging from the price action. The actual signal takes place when the faster % K line crosses the % D line.Divergence-convergence is an indication that the momentum in the market is waning and a reversal may be in the making.
Stochastic Popoccurs when prices break out and keep going. This is interpreted as a signal to increase the current position, or liquidate if the direction is against the current position.
Conclusion
Oscillators provide good entry and exit signals but generally should be used in conjunction with other technical indicators and trading platforms.
Click Here To Watch Webinar On Stochastic Indicator
[email-subscribers namefield=”NO” desc=”Subscribe now to get latest updates!” group=”Public”]


