
In stock market, The Circuit Breaker scanner helps in identifying stocks that have immense profit making potential. The scan results of this scanner display a list of stocks that has hit the upper circuit or lower circuit for the day. The stock market trader can form a bearish or bullish view of the stocks based on this scan result and enter new short or long trades.
Would circuit breaker scanner helps in taking decision regarding investment in stock market?
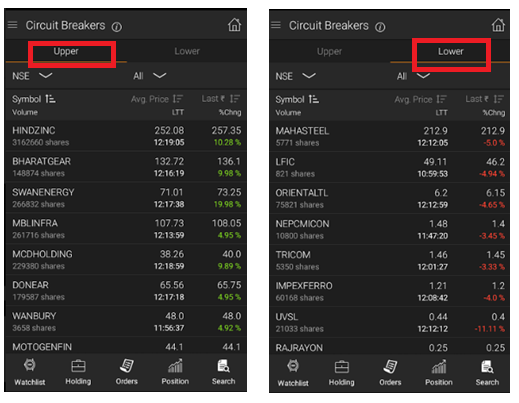
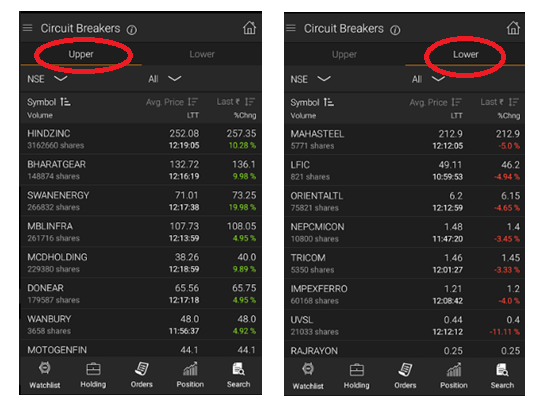
The scan results of Circuit Breaker scanner are divided into two categories – Upper and Lower.
Understanding a Circuit Breaker
Before interpreting the Circuit Breaker scanner results, let us first have a basic understanding of circuit breaker and its significance.
What is a circuit breaker? In simple terms, a circuit breaker works as an upper and lower limit that is imposed on a stock (or index) for the day. The stock is supposed to trade only between these two imposed ranges.
Whenever the upper or lower range is breached, the circuit breaker system will get triggered.
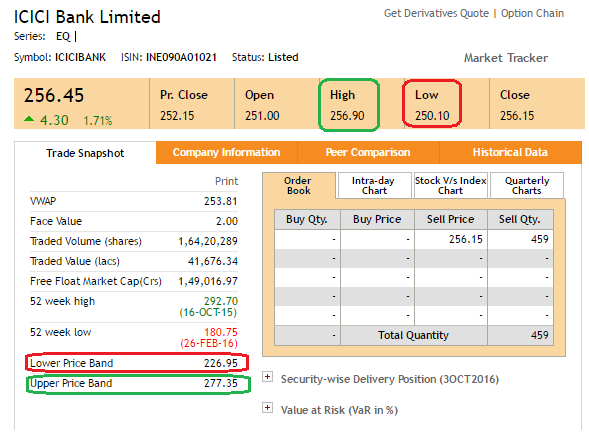
Example: In the above figure, ICICI Bank has a lower price band of 226.95 and an upper price band of 277.35. These are the lower and upper circuit limits for the day. If the stock trades above or below these limits, the circuit breaker would get triggered. Note that these values are different from the ‘High’ and ‘Low’ of the stock.
How are limits set? The circuit limits for a stock (or index) are set daily by SEBI, based on the previous day’s activity of the stock.
When is Circuit Breaker Triggered? An upper circuit breaker is triggered whenever the stock (or index) moves upwards and breaches the set upper limit of the day. Similarly, a lower circuit breaker is triggered whenever the stock (or index) moves downwards and breaches the set lower limit of the day.
Typically, the upper or lower circuit limit is breached whenever there is a high level of buying activity or selling activity.
Get The Best Trading App
Start Trading With Us
Also Read : Spreads Scanner
What happens after triggering? As soon as the circuit breaker is triggered, trading is stopped for the day for that stock. In the case of Index, the rules and the limits are slightly different and can be seen on the NSE website.
Why is circuit breaker necessary? A circuit breaker is basically used by SEBI for controlling the price fluctuations of the stock in upward as well as downward direction. This helps in preventing panic selling as well as protects the stock market from suddenly escalating into one direction.
Next, let us see the two categories of Circuit Breaker Scanner Results – Upper and Lower.
Circuit Breaker – Upper
The scan results that are displayed in the ‘Upper’ section of the Circuit Breaker scanner shows a list of stocks that had hit the upper circuit for the day.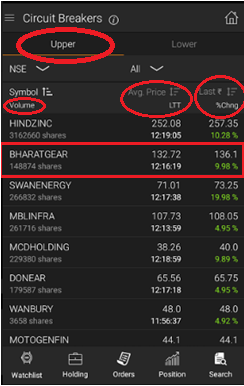
The above Sine trading app images shows the Circuit Breaker – Upper category scan results. The results of the scan displayed consists of mainly three values –Volume; Average price with LTT; and Last Price with % Change.
Note: LTT is the Last Traded Time
Example: In the figure, you can see that the stock BHARATGEAR is listed in the ‘Upper’ category of the circuit breaker scan result. The stock has a volume of 148874 shares, average price of 132.72, LTT of 12:16:19, last price of 136.1, and % change of 9.98%.
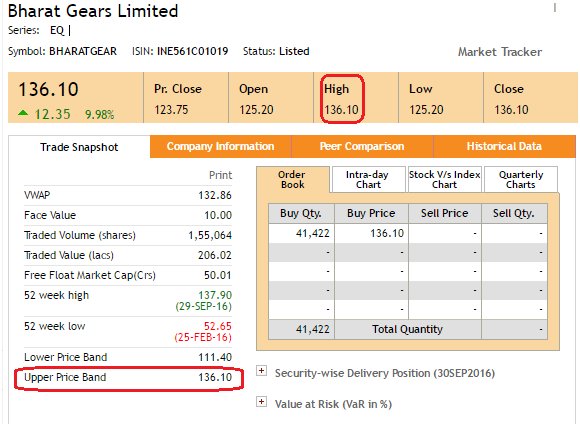
On checking the NSE website, you can see that the stock BHARATGEAR has an upper price band (or upper circuit limit) of 136.10. Hence, the stock appeared in the results of Circuit Breaker scanner – ‘Upper’ category.
 Circuit Breaker – Lower
The scan results that are displayed in the ‘Lower’ section of the Circuit Breaker scanner shows a list of stocks that had hit the lower circuit for the day.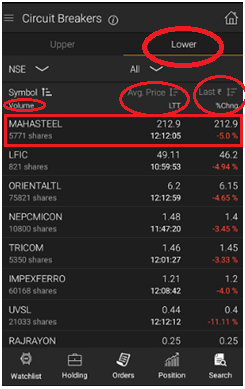
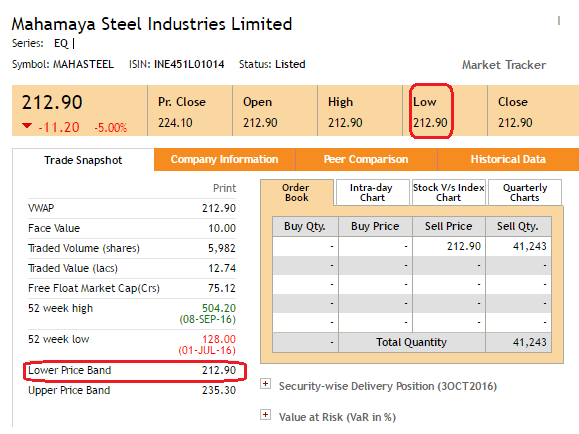
The above Sine trading app images shows the Circuit Breaker – Lower category. The results of the scan displayed consists of mainly three values – Volume; Average price with LTT; and Last Price with % Change.
Example: In the figure, you can see that the stock MAHASTEEL is listed in the ‘Lower’ category of the circuit breaker scan result. The stock has a volume of 5771 shares, average price of 212.9, LTT of 12:12:05, last price of 212.9, and % change of -5.0%
On checking the NSE website, you can see that the stock has a lower price band (or lower circuit limit) of 212.9. Hence, the stock appeared in the results of Circuit Breaker scanner – ‘Upper’ category.
How to interpret trend using Circuit Breakers scanner results
The result of Circuit Breaker scanner can be used for evaluating the general trend of the stock.
- When the stock hits its upper circuit with a corresponding rise in price, a bullish trend is indicated.
- When the stock hits its lower circuit with a corresponding fall in price, a bearish trend is indicated.
This can also be indicated as shown in table below
| Upper/ Lower Circuit Hit? | Price Movement | Trend |
| Upper Circuit |
|
Bullish |
| |
Bearish |
Click to Download
SINE Trading App Now
Steps to get the list of stocks of ‘Circuit Breakers’ Scanner Criteria
Step #1: Login to Sine Trading App and click on the dropdown icon from Dashboard page.
Step #2: From the drop-down menu displayed, click on ‘Analytics’
Step #3: From the Analytics page, click on ‘Circuit Breaker’ scanner.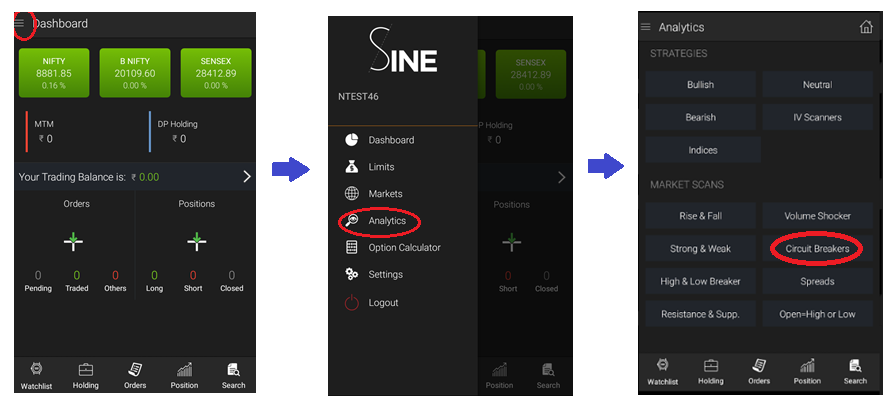
Step #4: The results of the scan would be displayed in two tabs – Upper and Lower – as shown below
Also Read : Rise & Fall Scanner
Functions that can be performed on the Scanner Results list
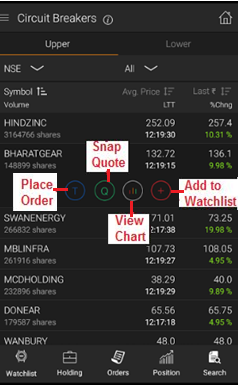
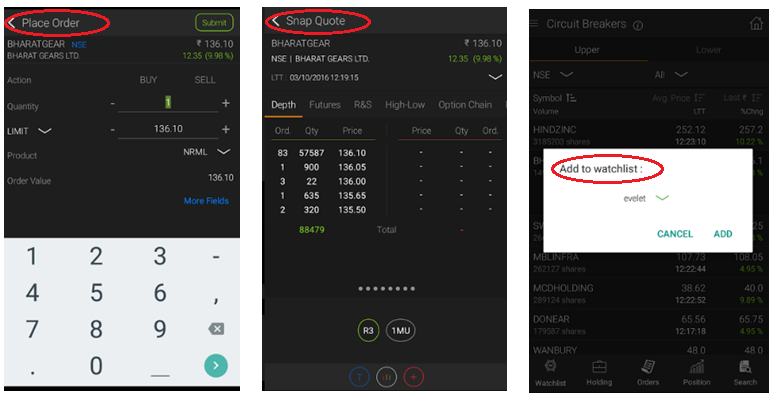
Various functions can be performed on the scanner results. For doing that, click on any of the stocks of the scan result. Then the associated functions would be displayed below it. Following functions can be performed on each of the stock that is displayed as the scan result:
- Add to Watchlist
- Snap Quote
- Place order
- View Chart – includes indicators like Bollinger Bands. MACD, moving averages, RSI etc.
On clicking on each of those symbols, the corresponding function is executed. The figure below shows the various functions.
Conclusion
Circuit Breakers Scanner lists out stocks that had hit the upper or lower circuit for the day. This scanner can be used to identify the general trend of the stock and thus enter into profitable trades.
Next, we will take a look at the scanner called High and Low Breaker.
[email-subscribers namefield=”NO” desc=”Subscribe now to get latest updates!” group=”Public”]



[…] Also Read : Circuit Breakers Scanner […]
[…] Also Read : Circuit Breakers Scanner […]
[…] our previous article, you must be already familiar with the functions and applications of ‘Circuit Breakers’ scanner, as well as how to utilize the scanner for picking out profitable trades. Now, let us […]